
When you have students participating in our stock game, it can be a struggle to get students to understand the basics of conducting research and comparing stocks.
After all, between stock prices, the news, financial statements, stock charts, and what they hear from their friends, there is a lot of noise out there – and hard to teach students what it really means to do “research”.
Introducing The Stock Comparison Tool
PersonalFinanceLab’s newest addition is a super-simple tool that students can use to learn how to conduct basic stock research and choose their first stocks.
The tool is not an automated system that uses complicated data feeds to spit out an answer for students to blindly pick – instead, it is an interactive tutorial that walks students through how to find and interpret key information about a stock, find the same information about a similar company, and walks them through how to compare these metrics, apples to apples, to make a decision on what to add to their portfolio.
How The Stock Comparison Tool Works
The Stock Comparison Tool is an exercise where students are prompted to gather data about a stock from 6 sources:
- The stock’s Quote
- Income Statement
- Balance Sheet
- Cash Flow Statement
- Historical Prices
- News Featuring This Company
At each step, the Tool guides students on where to find each of these sources, all directly within the PersonalFinanceLab platform.
After finding all of the data points for one single stock, it then shows students how to use a Stock Screener to identify other companies in the same sector or industry as their first stock – and pull the same data for the comparison stock.
Once the student has all information from both stocks, the Tool guides students through making an apples-to-apples comparison to guide them towards which choice would be the best option for their own portfolio.
What Is Compared
One of the strengths of the Tool is that it introduces students to a wide range of different data sources they can look at for each stock, without being too complex or time-consuming for a beginner. The specific data points students learn to find and analyze include:
- Ticker Symbol, from our Symbol Lookup tool
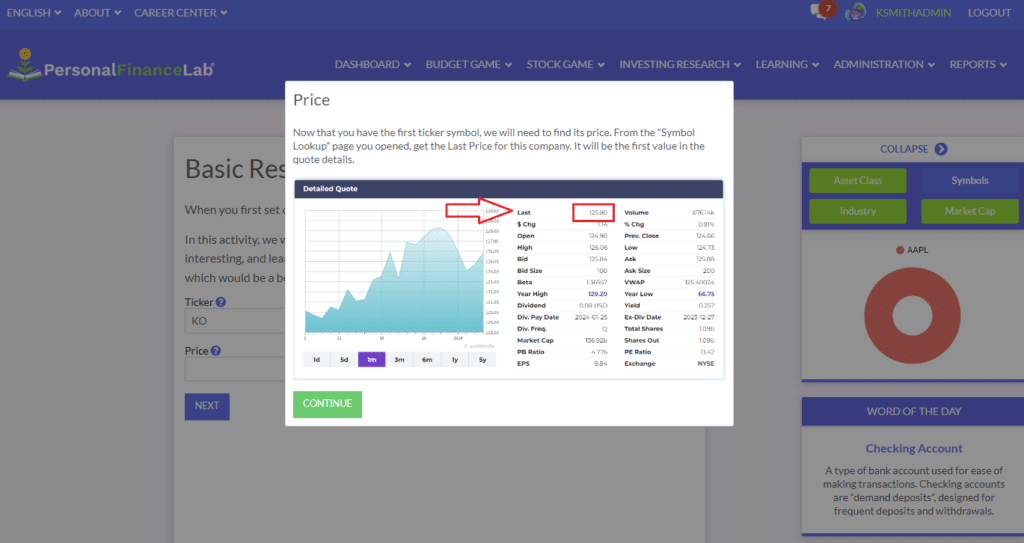
- Price, from a stock quote
- Earnings Per Share, from a stock quote
- Dividends, from a stock quote
- The trend of the last 3 years of Net Income, from the Income Statement
- The trend of the last 3 years of Shareholder’s Equity from the Balance Sheet
- The trend of the last 3 years of Cash and Cash Equivalents from the Cash Flow Statement
- The total price change from the stock’s Historical Prices
- A measure of how volitle the stock is from the stock’s Historical Prices
- And the general sentiment of how the market as a whole feels about this stock from the News Feed
Most importantly, as your students find each data point (and compare with another stock), the built-in tutorial explains what exactly each of these data points are measuring, why they are important, and how to interpret them.
While these data points are in no way exhaustive of everything an investor can investigate before buying a stock, together they make a powerful introduction to basic research and financial statements for students.
Using The Tool In Class
Teachers can assign the Stock Comparison Tool to their class as part of an Assignment (found in the group of Intermediate Investing Tips) for students to practice for the first time, but students can find and leverage the Tool all throughout their class period from our Investing Research Center.
Try It Out
Teachers can try out our Stock Comparison Tool by clicking here. Note – you must have a PersonalFinanceLab account to view. If you are not already signed up for PersonalFinanceLab, feel free to try it out with our Teacher Test Drive!
Happy Learning!
-The PFinLab Team