In Economics, “Gross Domestic Product” is the one statistic to rule them all – a measure of the total size of an economy.
Definition
The “Gross Domestic Product” of a country is the total value of all finished goods and services that were produced in a given year. In other words, this is the total economic output. GDP is used to measure the total size of an economy, and therefore how much the economy has grown (or shrunk) in a year.
Calculating GDP
 There are a few ways to calculate GDP, but the easiest measurement looks at consumption, investment, government activity, and net exports.
- Consumption – how many goods and services were purchased by households each year (this doesn’t include business purchases)
- Investment – how much money was saved, or otherwise invested each year (this does include business investments)
- Government Activity – how much money the government spent each year
- Net Exports – How much the country imported vs exported each year
Remember: GDP is supposed to calculate the production in one country each year. If there is household consumption of imported goods, we need to subtract it. If goods are exported and consumed in another country, we need to add it.
Net Exports = Exports – Imports
This means the final calculation for Nominal GDP is:
GDP = Consumption + Investment + Government Spending + Net Exports
Nominal VS Real GDP
Calculating GDP for one year is pretty easy, but GDP numbers are most useful when we compare them from year to year. The only problem is that prices aren’t the same every year – we can’t increase the size of our economy just by doubling all the prices. This means once we calculate the “Nominal” (not adjusted for inflation) GDP above, we need to translate this into a “Real” (adjusted for inflation) GDP to use it for research.
Real GDP = Nominal GDP x (1 – Inflation)
Per Capita GDP
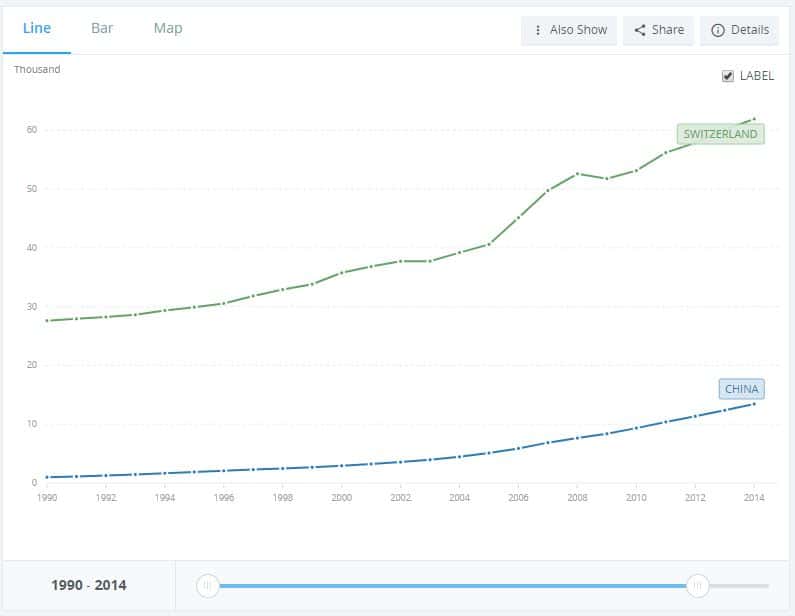
Economists usually want to go one step further – instead of just calculating the size of the economy, we really want to know how much is being produced per worker. This is called “Per Capita” GDP – it lets us see how much more or less each country produces compared to another.
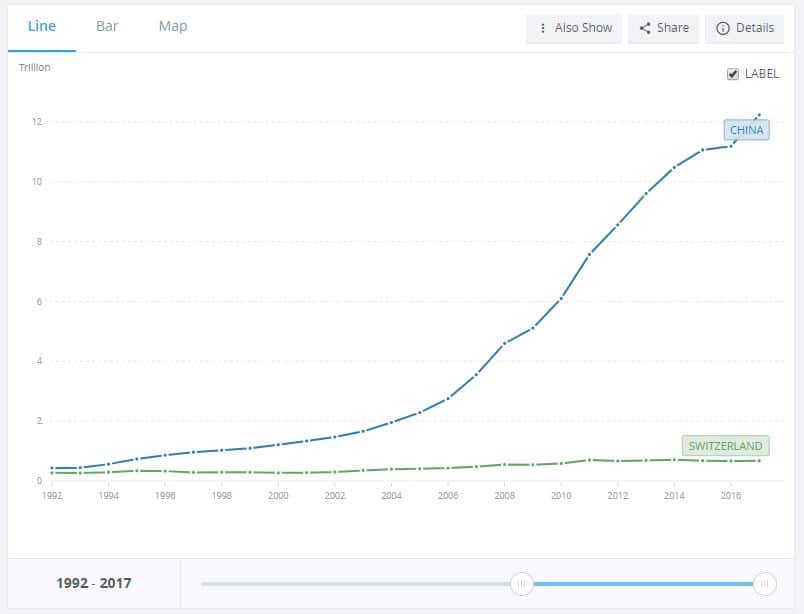
For example, if you look at the GDP of China vs Switzerland, it looks like China is much richer:

Source: World Bank https://data.worldbank.org
However, if we adjust this to look at the output per worker, it shows a much different story:

Government policy is not usually focused on increasing the total GDP, but increasing the Per Capita GDP.
What Causes GDP To Increase?
 GDP increases when output increases. When we look at how much a country could potentially produce in a given year, if its resources were all being utilized to the maximum, we would consider:
- The total population (Quantity of Workers) – how many workers are available?
- The skill level of the population (Quality of Workers) – how well are the workers trained? Are there a lot of college graduates and skilled tradesmen, or mostly farmers working by hand?
- Quantity of available capital – how many factories, machines, and tools are available? Having a huge population doesn’t help if they can’t be given the tools to do valuable work!
- Quality of available capital – how good are the machines and tools available? Are they fairly new and well working, or are they old and out of date?
- Quantity of natural resources – how big is the country? Is there plenty of farmland and places to mine valuable minerals?
- Quality of natural resources – how easy is it to get those natural resources? For example, an oil field near a major city in Texas is much easier to drill and exploit than an oil field in the middle of Alaska
- Level of Technology – how much research and development is going on? How likely is it that even better tools and machines will be produced next year, and how fast can they be produced?
- Legal and Cultural Institutions – how important is economic growth to the country? Does the government make it possible for new business to start easily, or is there a lot of red tape?
There isn’t much a country can do about their total population or the available natural resources, but governments do focus on improving the rest of these factors to try to improve economic growth.
Leapfrog Effects
Thanks to international trade, GDP tends to grow much faster in countries with lower per-capita GDP. This is because of something called the “Leapfrog Effect”.
 Think of it this way: England spent over a hundred years and the equivalent of billions of dollars building railroads all over their country to help speed up trade. Every year, companies would spend millions to make small improvements to the rail engine technology. This slowly improved their technology, quantity, and quality of capital goods.
In contrast, China has been rapidly expanding their rail network starting in the 1950’s. This means when they first started building their rail networks, they were able to just buy the newest, most up-to-date trains from England, “leap-frogging” a hundred years of research and development to get the same capital goods and level of technology.
This can be risky for the country with the lower per capita GDP. In China’s case, the government mandated that all households needed to make huge cuts to their consumption in order to put all of their existing economic output towards investment to buy the new machines. Since the workers were poor to start with, there were many deaths from starvation. For other countries, they typically take out loans from international banks to pay for the new machines. This is less hard on the workers immediately, but it means they will be saddled with debt until they can earn enough to pay back the loans.
Almost all developing countries accept some of these risks, and use the leapfrog effect to rapidly increase technology, and their GDP with it. This lesson is part of the PersonalFinanceLab curriculum library. Schools with a PersonalFinanceLab.com site license can get this lesson, plus our full library of 300 others, along with our budgeting game, stock game, and automatically-graded assessments for their classroom - complete with LMS integration and rostering support!

Get PersonalFinanceLab
[qsm quiz=190]
