Definition
In Economics, “Demand” is the relationship between prices and how much people want to buy a good or service.
Details
 As the market price of a good goes up, the amount of that good that people are willing to pay generally goes down. This is because each person puts some value on the good – if the price is higher than the amount a person values it, they will not buy it.
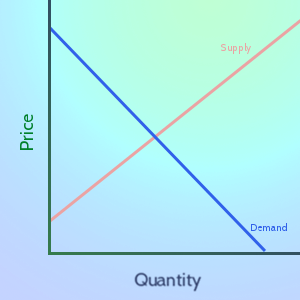
However, notice on the graph on the right that at a price of 0, there is still a maximum people are willing to take. For example, even if oranges were free, you still wouldn’t take home a truck full of them – they would rot before you had a chance to eat them. The opposite is also true – the price can get so high that nobody is willing to buy, and the quantity demanded is zero.
Difference Between Demand And Quantity Demanded
“Demand” refers to the relationship between the price and quantity – in our graphs, the “Demand” is the entire blue line. The quantity demanded is a single point on that line.
This means that a change in “Demand” means the entire line has moved, while a change in the “quantity demanded” means the quantity has moved to a different point on the same line (due to a change in Supply).

Increase in Demand

Increase in Quantity Demanded
An increase in demand can come from many places. The biggest is called an increase in “consumer tastes and preferences”, where a product becomes more “in style” or consumers become more aware of it. This can sometimes be the result of a marketing campaign.
An increase in demand can also come from a similar product changing price. For example, if ketchup and mustard suddenly become lower in price, the demand for hot dogs and hamburgers could increase as a result. Another impact could be a general increase of income – if all people are making a bit more money than they were before, they have more to spend and so demand more goods and services.
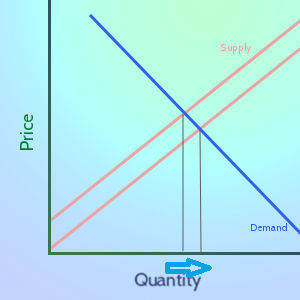
The quantity demanded, however, will move because of both shifts in supply and shifts in demand. If Demand shifts up, it means a higher quantity of a good is demanded at the same price as before (see the left graph above). If supply increases (like the graph on the right), the quantity demanded will also go up.
Examples With The Stock Market
The stock market is a great place to see how demand and the quantity demanded changes in action.
If you are thinking about buying a stock, you are part of the “Demand” for that stock. At what price you’re willing to buy, and how many shares, is your current demand.
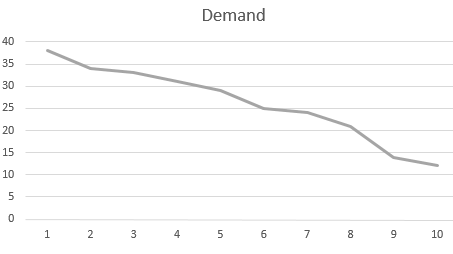
Imagine there is a stock that 10 people want to buy a share of. Each of them has a “maximum price”, meaning the most they would be willing to pay for a single share based on how much they think that stock is worth.

Then this would be the demand line for this market:

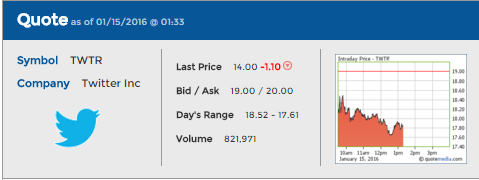
The actual quantity demanded is dependent on what price producers are willing to sell at. Let’s consider a real example – what if all these people wanted to buy Twitter stock (symbol: TWTR)? We can find out by getting a quote from the Trade page:

This quote can tell us about the demand, and what would happen in this case. The “Last Price” is $14 – that is because that is the most the last buyer was willing to pay to buy a share.

We can look at the “Bid / Ask” price to know how much the closest buyers and sellers are to each other – we can see that our buyer with the next-highest value, the person who would buy the stock at $19, is the current highest “bidder”. However, the next-lowest seller wants at least $20 (the “Ask” price), so a trade is not made.
This means that for today, the quantity demanded is 8.
Pop Quiz
[qsm quiz=51]
