Stock Game Project
Grading Rubric

This project guides students to develop an investing strategy, make informed decisions, analyze their performance, and reflect on what they learn as they play the Stock Game.

Project Overview

The project is broken down into five key tasks, each building on the last:

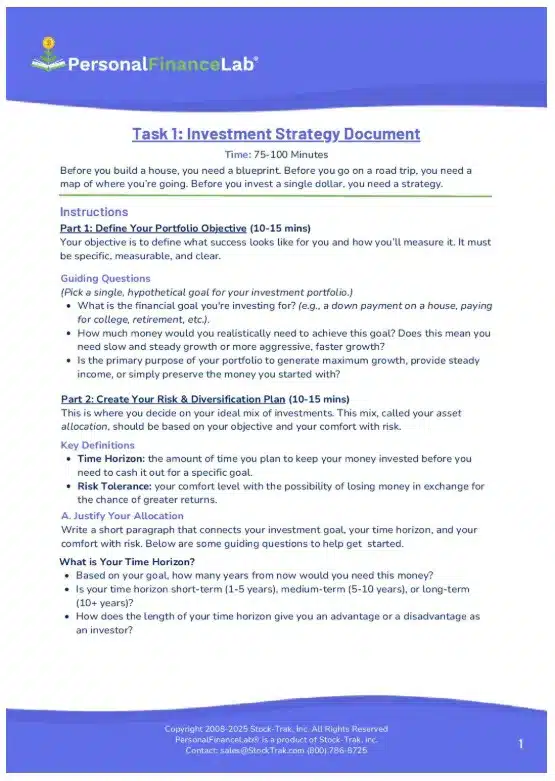
Task 1: Investment Strategy Document

Students set their investing goal for their virtual portfolio.

View Task
Task 1: Investment Strategy Document

Task 2: Weekly Portfolio Sync

Students build a routine of managing their portfolio and discuss the impact of world events on their holdings.

View Task
Task 2: Weekly Portfolio Sync

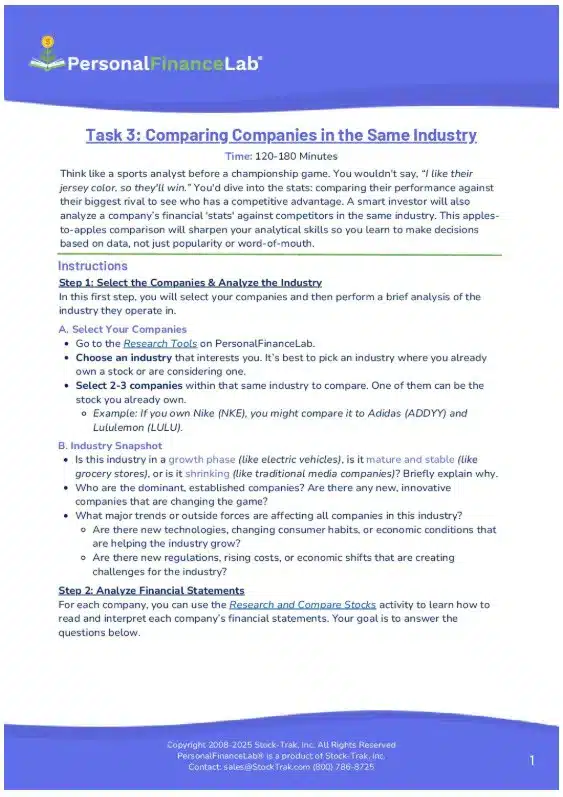
Task 3: Comparing Companies in the Same Industry

Students dive deeper into fundamental analysis.

View Task
Task 3: Comparing Companies in the Same Industry

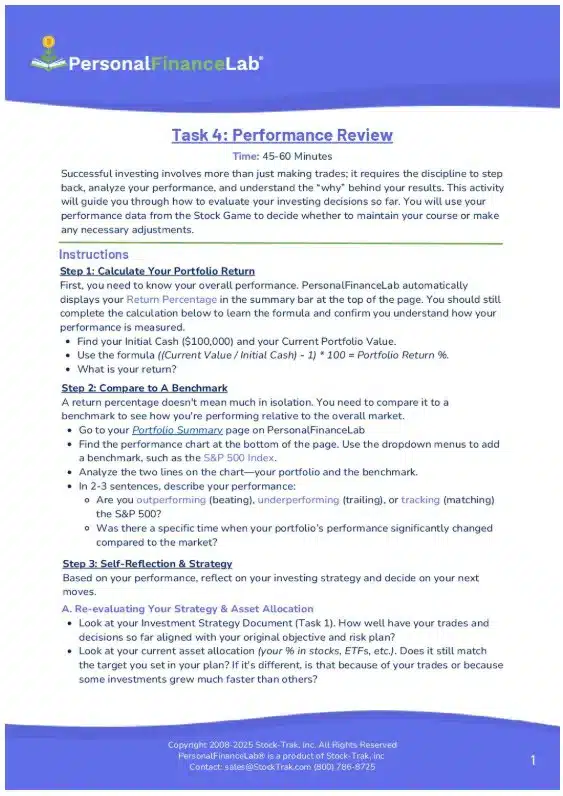
Task 4: Performance Review

Students assess their progress and adjust their strategy.

View Task
Task 4: Performance Review

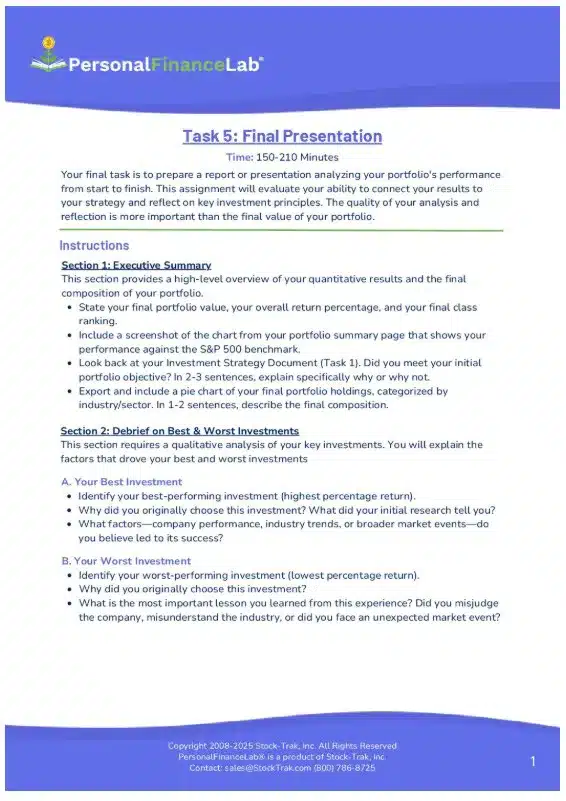
Task 5: Final Presentation

Students summarize what they learned from playing the Stock Game.

View Task
Task 5: Final Presentation

Task 1: Investment Strategy Document

Estimation Time: 75 to 100 minutes

Introduce this first task as the most important step in the entire project. It’s the foundation upon which all future decisions will be made about how students manage their virtual portfolio in the Stock Game.

Address The Class

“Before you build a house, you need a blueprint. Before you go on a road trip, you need to know where you’re going. And before you invest, you need a strategy. Your first assignment is to create your Investment Strategy Document. When the market gets volatile and you feel the urge to panic-sell or chase a hot stock pick, this document will be your guide to making logical, unemotional decisions. A good strategy is what separates investing from gambling.”

  • Implementation Plan & Student Instructions
    Task 1 Investment Strategy Document

    Implementation Plan

    Download PDF

    Given the total time commitment, this task is best broken into two parts: an in-class conceptual session and a research-focused homework assignment. Alternatively, you can break this up into two class sessions if you prefer students complete all work in class.

    Session 1: The Conceptual Foundation (35-40 mins)

    • Introduction (5 min): Hand out the activity sheet. Introduce the “blueprint” analogy and emphasize that this document will guide all their future decisions.
    • Guided Work Time (30 min): Have students focus on completing Part 1 (Objective) and Part 2 (Risk & Diversification Plan). These sections are about the “big ideas” and are best completed in the classroom where you can answer questions about time horizon, risk, and strategy.
    • Q&A and Individual Study (5-10 min): Review the requirements for Part 3. Explain that this next step involves research and calculation, making it ideal for individual study.

    Session 2: Research and Calculations (55-60 mins)

    Students will work independently to complete Part 3. This allows them the flexibility to explore the research tools on PersonalFinanceLab, find investments that interest them, and complete all the calculations and placing their first trades. The final document is due at the start of the next relevant class period.

    Final Student Deliverable

    Students will submit a completed document that includes their Portfolio Objective, Target Asset Allocation table, Justification Paragraph, and a list of their initial trades with rationales.

    Student Instructions

    1. Define a Portfolio Objective:

    Students will articulate a specific and measurable goal for their investment portfolio (e.g., saving for a specific purpose, achieving a target growth rate, etc.).

    2. Create a Risk & Diversification Plan:

    • Students are introduced to the key concepts of Time Horizon and Risk Tolerance.
    • They write a justification paragraph connecting their personal goal, time horizon, and risk tolerance.
    • They complete a Target Asset Allocation table, assigning percentages of their portfolio to different asset types (Stocks, ETFs, Bonds, etc.).

    3. Plan the First Trades:

    • Students identify their first 2-5 investments and write a brief rationale for each, explaining how it aligns with their strategy.
    • The worksheet then guides them through the practical math of executing a trade:
      • Step 1: Calculate the dollar amount to invest in a specific asset based on their target allocation.
      • Step 2: Look up the asset’s current price.
      • Step 3: Calculate the number of shares they can afford, rounding down to the nearest whole number.

Grading Rubric

Criteria (Weight) 4 PTS – Exemplary 3 PTS – Proficient 2 PTS – Developing 1 PT – Beginning

Portfolio Objective (25%)

Objective is highly specific, measurable, and clearly connected to a logical investment approach.

Objective is clear and measurable, providing a good target for the portfolio.

Objective is vague or lacks a measurable component (e.g., “to make money”).

Objective is missing or incoherent.

Risk & Diversification Plan (40%)

Provides a clear target asset allocation with a sophisticated rationale that demonstrates a deep understanding of diversification principles.

Provides a clear target asset allocation with a logical rationale explaining the investment mix.

Provides a target allocation but with a weak or confusing rationale, showing a limited understanding of diversification.

Fails to provide a clear asset allocation plan or rationale.

Initial Trade Rationale (35%)

Provides insightful, well-researched rationales for each initial trade that explicitly connect to the overall portfolio objective and diversification plan.

Provides clear rationales for each trade that connect to the portfolio objective.

Provides rationales, but they are generic or show limited research (e.g., “I heard this stock is good”).

Rationales are missing or do not logically support the investment choice.

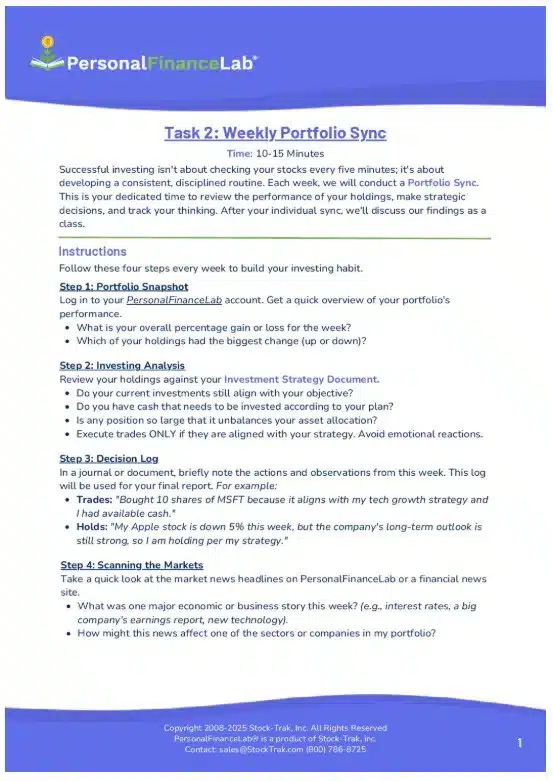
Task 2: Class Activities – Weekly Check-ins

Estimated Time to Complete (Weekly)

  • Individual Portfolio Sync: 10-15 minutes.
  • Class Discussion: 10-15 minutes.
  • Total Weekly In-Class Time: 20-30 minutes.

Address The Class

Successful investing isn’t about checking your stocks every five minutes. It’s about developing a consistent routine. Each week, we will have a 15-minute ‘Portfolio Check-in.’ This is your time to log in, review your holdings, make any trades that align with your strategy, and take notes. The goal is not to see who is ‘winning’ each week, but to practice the discipline of managing a portfolio. I’ll be asking a few of you to share one thoughtful decision you made, or one thing you learned about the market that week.”

  • Implementation Plan & Open-Ended Discussion Questions
    Task 2: Class Activities - Weekly Check-ins

    Implementation Plan

    Download PDF

    This activity is most effective when it becomes a predictable part of the class schedule.

    1. Establish a Routine: Designate a specific day and time for this (e.g., “Investment Tuesdays,” the first 25 minutes of class every Friday).
    2. Phase 1: The Individual Sync (10-15 min): Announce the start of the Portfolio Sync. Allow students to work quietly and independently on their devices, following the 4-step routine on their activity sheet. Circulate to ensure students are on task and using their Decision Log.
    3. Phase 2: The Class Discussion (10-15 min): After the timer goes off, instruct students to put their screens down. Use the open-ended discussion questions to facilitate a conversation.
      • Pro-Tip: Make a habit of calling on different students each week. Use a class roster to track who has shared to ensure you hear from everyone over time. During the discussion, use the rubric below to make quick, informal notes on student participation.

    Open-Ended Discussion Questions

    • Looking at your portfolio, share one investment you are choosing to HOLD. Why does it still fit your original strategy?
    • Did anyone feel tempted to sell an investment that was down this week? How does your formal strategy help you avoid emotional decisions?
    • What was a major market headline this week? How might that news impact a specific sector or a company in your portfolio?

Grading Rubric

Criteria (Weight) 4 PTS – Exemplary 3 PTS – Proficient 2 PTS – Developing 1 PT – Beginning

Preparation & Engagement (30%)

Student is highly prepared, having completed the sync routine, and proactively contributes to the discussion without prompting.

Student is consistently on-task during the sync and is prepared to answer questions when called upon.

Student is generally on-task but requires prompting to engage. Preparation seems minimal.

Student is frequently off-task during the sync or is clearly unprepared for the discussion.

Quality of Contribution (40%)

Offers a thoughtful insight or a well-reasoned justification for a decision that deepens the class’s understanding. Consistently and explicitly links their actions back to their Investment Strategy Document.

Provides relevant comments that clearly connect their portfolio’s performance to their investment strategy or a specific market event.

Offers a surface-level comment (e.g., “My stock went up”) but struggles to connect it back to their strategy or a market event.

Comments are vague, off-topic, or show limited understanding of their own portfolio.

Active Listening & Interaction (30%)

Actively listens and builds on a classmate’s comment or asks an insightful follow-up question, helping to advance the conversation.

Listens respectfully to the contributions of peers and is attentive throughout the discussion.

Passively listens but does not interact with peers’ comments or ideas.

Does not pay attention when others are speaking or is a distraction to others.

Task 3: Comparing Companies in the Same Industry

Estimated Time to Complete

This task that will likely require 2 to 2.5 hours (120-180 minutes) of focused work.

Address The Class

“Think like a sports analyst before a championship game. You wouldn’t just say, ‘I like their jersey color, so they’ll win.’ You’d dive deep into the stats: comparing their performance against their biggest rival to see who has a real competitive advantage. A smart investor does the same thing. Instead of choosing a stock just because they like the brand, they analyze a company’s financial ‘stats’ against its competitors. This ‘apples-to-apples’ comparison will sharpen your analytical skills, teaching you to make decisions based on data, not just popularity.”

  • Implementation Plan
    Task 3: Comparing Companies in the Same Industry

    Implementation Plan

    Download PDF

    Given the substantial time commitment (2-3 hours), this project is best broken into three distinct class sessions. This structure allows students to complete all work in class.

    Session 1: Research Kick-off (45-50 mins)

    • Introduction (10 min): Hand out the activity sheet. Introduce the “sports analyst” analogy to frame the project and walk through the four main steps so students understand the full scope of the assignment.
    • Guided Work Time (35 min): Have students focus on completing Step 1: Select the Companies & Analyze the Industry. Students will benefit from your guidance as they explore industries, select appropriate competitors, and analyze the broader market trends.
    • Transition (5 min): Explain that the next session will be dedicated to learning how to interpret financial statements and gathering data on the companies they selected.

    Session 2: Financial Data Gathering (45-50 mins)

    • Check-in (5 min): Begin with a quick Q&A to address any lingering questions from the previous session.
    • Individual Study (40 min): This session is for focused, independent research. Students will work on their devices to complete Step 2 (Analyze Financial Statements) and Step 3 (Beyond the Numbers). Your role here is to circulate as a facilitator, helping students navigate the research tools and interpret the financial data they uncover.

    Session 3: Writing the Investment Analysis Report (45-50 mins)

    • Introduction (5 mins): Frame the session’s goal: “You’ve gathered all your evidence. Now each of you is a financial analyst writing a report.” Briefly review the required structure for the one-page report outlined in Step 4.
    • Independent Study (40-50 mins): Students will spend this session writing their Investment Analysis Report. As they write, you can help them synthesize information, use data to support their claims, and structure a strong, evidence-based investment thesis in their conclusion.

    Final Student Deliverable

    Students will submit a completed one-page Investment Analysis Report containing an industry overview, a data-driven analysis of each competing company, and a final investment thesis justifying their recommended choice.

Grading Rubric

Criteria (Weight) 4 PTS – Exemplary 3 PTS – Proficient 2 PTS – Developing 1 PT – Beginning

Data Collection & Use (40%)

Accurately collects and references specific, relevant data points from all three financial statements for all companies being compared.

Accurately collects key data from the financial statements for each company.

Attempts to collect data but includes inaccuracies or omits key financial statements.

Fails to collect or use relevant financial data.

Comparative Analysis (40%)

Provides a thorough, data-supported analysis that expertly contrasts the companies’ financial health, profitability, and industry position.

Provides a clear analysis comparing the companies based on the collected data and industry trends.

Analysis is limited or surface-level, often stating data without explaining its significance in a comparison.

Provides little or no analysis.

Clarity & Justification (20%)

Conclusion is clear, compelling, and strongly justified by the preceding analysis, making a definitive investment choice.

Makes a clear investment choice that is logically supported by the analysis.

Conclusion is unclear or not well-supported by the analysis presented.

Fails to provide a clear conclusion or justification.

Task 4: Performance Review

Estimated Time to Complete: 45-60 Minutes

This task is a self-reflection focused activity that can be completed within a single class period.

Address The Class

“We’re now at the halfway point of our simulation. It’s time for a ‘report card’ for your investment portfolio. This isn’t just about your rank; it’s a chance to evaluate your strategy. Is it working the way you expected? How are you performing compared to the overall market? The goal of this review is to be honest with yourself about what’s working and what isn’t, and to create a clear plan for the rest of the game. Great investors are always learning and adapting.”

  • Implementation Plan
    Task 4: Performance Review

    Implementation Plan

    Download PDF

    This activity is ideal for a single, focused class session.

    Introduction (5 min)

    Frame the activity using the “Halftime Report” analogy. Explain that the goal is not about judging their score, but about the quality of their strategic thinking for the second half. Hand out the activity sheet.

    Individual Study (35-45 min)

    Allow students to work independently on their devices to complete the three steps on the worksheet. Your role is to circulate and help students who have trouble with the calculations or encourage more strategic reflections.

    Class Discussion (5-10 min, optional but recommended)

    In the last few minutes of class, facilitate a brief discussion. Ask a few students to share their key takeaway or a change they plan to make.

    Final Student Deliverable

    Students will submit their completed one-page report at the end of the class period or at the start of the next one.

Grading Rubric

Criteria (Weight) 4 PTS – Exemplary 3 PTS – Proficient 2 PTS – Developing 1 PT – Beginning

Performance Calculation (30%)

Accurately calculates and reports the overall portfolio return with all work shown.

Correctly calculates and reports the overall portfolio return.

Attempts calculation but makes significant errors or omits the final percentage.

Fails to calculate the portfolio return.

Benchmark Comparison (30%)

Provides a clear and insightful comparison of portfolio performance against both class rankings and the S&P 500 benchmark.

Correctly identifies class rank and provides a clear comparison to the S&P 500 benchmark.

Reports class rank or benchmark performance, but the comparison is unclear or missing.

Fails to compare performance to peers or a benchmark.

Strategic Reflection (40%)

Offers a thoughtful and self-aware reflection on the current strategy, proposing a logical and well-justified adjustment for the future.

Provides a clear reflection on the current strategy and proposes a reasonable adjustment.

Reflection is surface-level, or the proposed adjustment is not clearly justified.

Provides little or no reflection or strategic thought.

Task 5: Final Presentation

Estimated Time to Complete: 2.5 to 3.5 hours

Frame this final task as their chance to act as a professional portfolio manager reporting back to a client on their performance and explain what they learned.

Address The Class

“We’ve reached the end of our investment journey. Your final task is to prepare a report or presentation analyzing your portfolio’s performance from start to finish. Think of yourselves as professional money managers reporting to your clients. You’ll cover your wins, your losses, and how you stuck to your strategy. But the most important part of this is the reflection. The final dollar value of your portfolio is far less important than what you can tell me you’ve learned about investing for the long term.”

  • Implementation Plan
    Task 5: Final Presentation

    Implementation Plan

    Download PDF

    This project is best implemented over 3+ class sessions to allow students adequate time for analysis, synthesis, and preparation. More classes will be required if you elect to have student presentations.

    Session 1: Data Gathering & Performance Analysis

    • Introduction (10 min): Hand out the activity sheet and review the four required sections. Clarify whether the final deliverable is a written report, a slideshow presentation, or a choice between the two.
    • Individual Study (40 min): Students will spend this session on the quantitative parts of the project: Section 1 (Executive Summary) and Section 2 (The Debrief). This involves gathering their final data and analyzing the performance of specific holdings.

    Session 2: Reflection & Synthesis

    • Q&A (5 min): Address any questions from the previous session’s data gathering.
    • Individual Study (45 min): This session is for the qualitative work. Students will focus on Section 3 (The Strategy Review) and Section 4 (Developing Your Investor Mindset).

    Session 3 (+4): Final Preparations & Presentations

    • Final Work Session: Dedicate this session for students to assemble their final written report or build their presentation slides. This allows them to focus on clarity, structure, and professionalism.
    • Presentations: If students are presenting, dedicate one or more full class periods for this. Keep presentations concise (e.g., 3-5 minutes per student) to ensure everyone has a chance to share their key findings and lessons learned.

Grading Rubric

Criteria (Weight) 4 PTS – Exemplary 3 PTS – Proficient 2 PTS – Developing 1 PT – Beginning

Performance Analysis (25%)

Accurately presents all final performance metrics and provides an insightful analysis of whether the initial objective was met, explaining the key drivers.

Accurately presents final performance metrics and clearly states whether the initial objective was met.

Presents performance metrics with some inaccuracies or omissions; analysis is limited.

Fails to present accurate performance metrics.

Investment Reflection (25%)

Provides a thorough analysis of the best and worst investments, demonstrating a deep understanding of the factors behind their performance and the lessons learned.

Clearly identifies the best and worst investments and explains the reasons for their performance.

Identifies best/worst investments but provides a surface-level or unclear explanation of their performance.

Fails to analyze the best and worst investments.

Strategic Connection & Long-Term Learning (30%)

Connects final outcomes to the initial strategy and offers profound, personal reflections on long-term investing principles based on the 7-year timeline hypothetical.

Connects outcomes to the initial strategy and provides clear, thoughtful reflections on long-term investing principles.

Shows a weak connection to the original strategy or offers generic, un-insightful reflections on long-term investing.

Provides little or no reflection on strategy or long-term principles.

Clarity & Professionalism (20%)

Report: Exceptionally well-organized, clear, and professional; free of grammatical/spelling errors.

Presentation: Highly engaging, speaks clearly and confidently; slides are professional and support the content effectively.

Report: Clearly organized and easy to follow; contains minimal grammatical/spelling errors.

Presentation: Is delivered clearly; slides are neat and easy to read.

Report: Some organization is present, but the flow is difficult to follow; contains several errors.

Presentation: Is unclear or difficult to follow; slides are cluttered or contain errors.

Report: Disorganized and very difficult to understand; contains numerous errors.

Presentation: Is ineffective; difficult to hear or understand.