
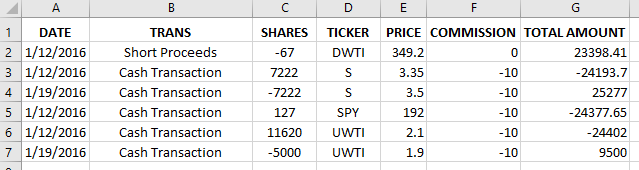
The most important reason you would want to use excel to track your stock portfolio is trying to calculate your profit and loss from each trade. To do this, open the spreadsheet with your transaction history. It should look something like this:

Tip: If you have not bought and then sold a stock, you can’t calculate how much profit you’ve made on the trade.
Simple Calculations
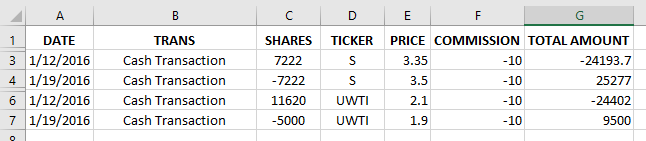
First, we want to change how the data is sorted so we can group all the trades of the same symbol together. Use the “Sort” tool to sort first by “Ticker”, next by “Date” (oldest to newest).
For DWTI and SPY, we haven’t ever “closed” our positions (selling a stock you bought, or covering a stock you short), so we cannot calculate a profit or loss. For now, hide those rows.
Now we’re ready to calculate! Lets start with the trade for S. This one is easy because the shares I sold equal the shares I bought. This means if we just add the “Total Amount”, it will tell us the exact profit or loss we made on the trade.
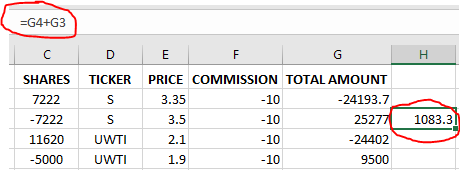
This does not work for UWTI, because I sold a different number of shares than I bought. This means that I need to first calculate the total cost of the shares I sold, then I can use that to determine my profit.
Different Buy/Sell Calculations
First: multiply your purchase price times the number of shares you sold:

Second: add this number to the “Total Amount” from when you sold your shares.
Now you have your profit or loss for this trade. Note: this is the method for if you bought more shares than you sold – if you bought shares at different prices, then sell them later, you’ll need to calculate your Average Cost to use in your calculation.
Average Cost Calculations
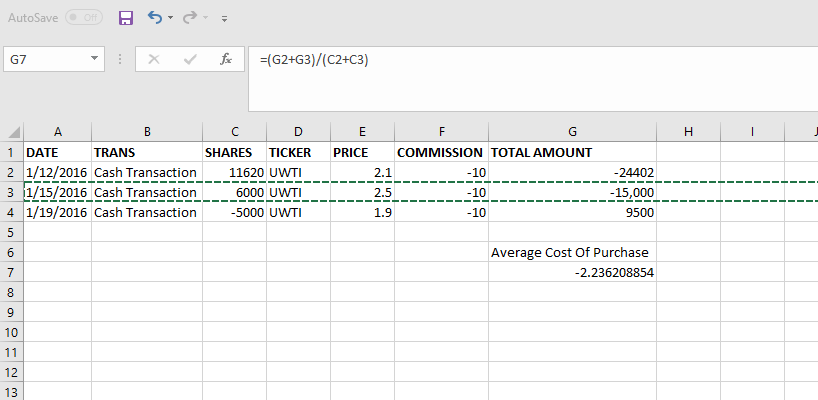
To calculate this, lets use the same example of UWTI shares and delete the rows of the S shares. Suppose we bought 11,620 shares on January 12th, as we did above, but also bought 6000 shares on January 15th for a different price at $2.5 per share. To calculate our profit or loss we would first have to calculate the Average Cost of the shares we bought. To do this, we need to add our total amounts for both purchases and divide that value by the total number of shares we bought. The calculation for this would be (24402+15000)/ (11620+6000), which would give us a value of $2.24. We can easily create a function on Excel or Google Sheets to calculate this for us. In this case, our function would be “=(G2+G3)/(C2+C3)” which should look something like this on Excel or Google Sheets:
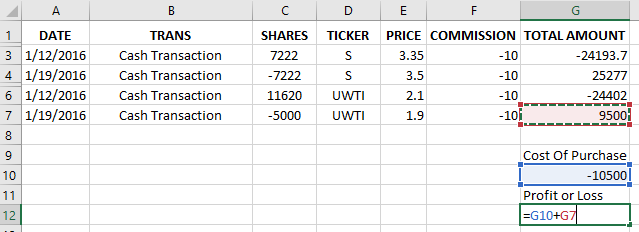
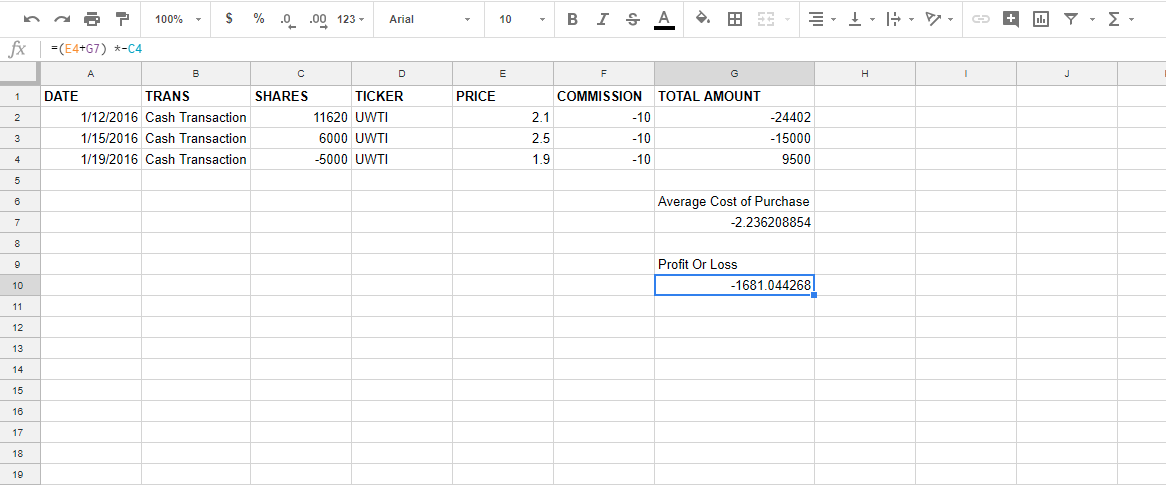
Next, we subtract this Average Cost from the Average Sale price of $1.9 and multiply the value we get by the number of shares we sold. This will then give us our profit and loss for the trade. We will have to create another function for this onto cell G10. However, since our average cost value is already negative, we would add it on our function instead of subtracting. Our function should be “=(E4+G7) *-C4” which should give us a value of $-1681.04 (Loss). We also put a negative sign in front of our C4 value to represent a sale. Our final spreadsheet should look something like this:
This lesson is part of the PersonalFinanceLab curriculum library. Schools with a PersonalFinanceLab.com site license can get this lesson, plus our full library of 300 others, along with our budgeting game, stock game, and automatically-graded assessments for their classroom - complete with LMS integration and rostering support!
Get PersonalFinanceLab
[qsm quiz=192]