
You can easily use the quote page on your brokerage account to locate stocks you might want to buy. If you know the ticker symbol you want to buy, or know the company’s name, you should be successful in locating the current price and status of any publicly traded security. Remember, some companies have multiple classes of stocks and/or other securities. You should know exactly what stock or security you’re looking for so you don’t get incorrect information and pricing.
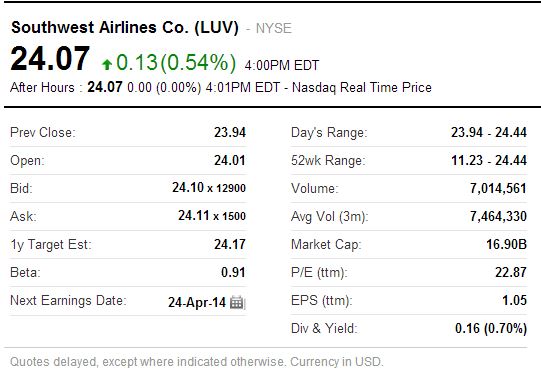
Type in “LUV” into the quotes page on your free trading account and should get something like this:

You should become comfortable with the data you receive when you look up a stock. Here are some brief explanations of the numbers:
- Last Price: The most recent price that the stock has traded.
- Today’s Change: The change in price (and the percentage change) compared to yesterday’s closing price.
- Today’s open: The first price at which this stock traded when the markets opened up this morning. Note that stocks DO NOT open at the same price that they closed at the day before.
- Volume: This indicates the number of shares that have traded today. Some stocks may trade millions of shares each day, and others only trade a few hundred or even zero shares per day.
- Previous Day’s Close: This number is the price of the stock for the last trade of the previous day.
- Bid/Ask: The “bid” is the highest price a buyer is currently willing to pay for a stock, while the “ask” is the lowest price at which a seller is currently willing to sell (sometimes this is also called the “offer”). The size is the number of shares for the bid or ask price.
- 52 Week High/Low: This is the highest/lowest price the stock has traded at during the last 52 weeks and allows you to compare the current price to its 52 week range.
- Charts: Stock charts come in a variety of formats. They all track pricing data, usually the OHLC (open, high, low, close), but they can display this information with different styles (lines, bars, candlesticks), different date ranges (day, week, month, year, 5 years) and other information like volume, moving averages and dozens of other indicators. If you like pictorial representations, you’ll find charts for every statistic and relationship for stocks.
- Annual Dividends: Dividends are cash payments that some companies make as a way of returning operating profits to the shareholders. If you own enough stock, you might have a wonderful income just from your stock dividends.
- Annual Dividend YieldThe annual dividend amount divided by the current stock price.: This is an important measure of return of the stock and is calculated as the Annual Dividend amount divided by the current stock price. If the stock is at $10.00 and the company pays out a cash dividend of $0.50, then the Annual Dividend Yield is 5%.
- EPS: Earnings Per Share displays the company’s earnings (profit) per share. It is calculated by dividing the company’s most recent annual income by the number of shares outstanding.
- Beta: Beta is used to measure the volatility of a stock as compared to the market as a whole. A beta of 1 means that it moves equally with the market. A beta greater than 1 means the stock moves up or down more quickly than the market overall; a beta between 0 and 1 means the stock doesn’t move as much as the market, and a negative beta means the stock moves in the opposite direction of the market.
Mark's Tip
Find a website that gives you the type of information you are looking for when you get stock quotes.
