![]()
Moving averages The Moving Average is a line on a chart that smooths out the recent price history by calculating the average price over 30 or 60 days (or any number of days). are among the most popular and – important for the newer investor – easy to use and understand trading “tools” available to you. Also, moving averages are used as components in many other charts and analyses. By smoothing out data points and number series, moving averages make it easier to identify trends and tendencies.
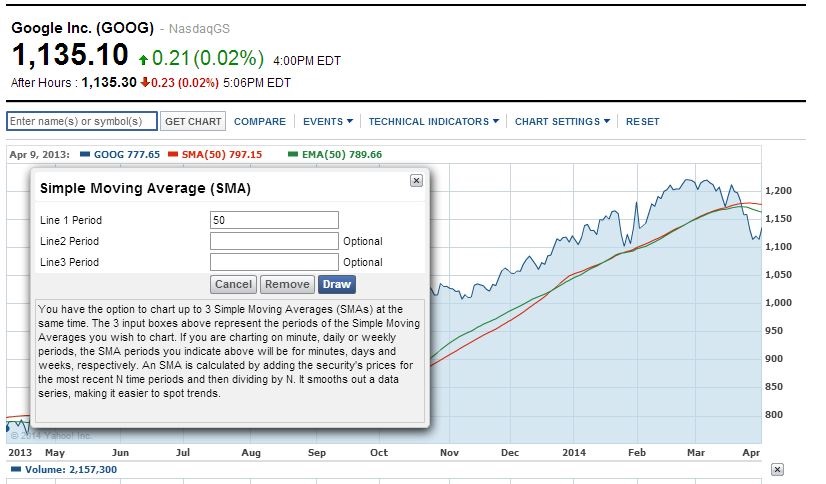
The most common examples are the simple moving average (SMA) and the exponential moving average (EMA). The SMA is generated by calculating the average price (usually closing price is used) over a number of time periods. An EMA attempts to better identify the built in “time lag,” by creating a weighted average, assigning more weight to the most recent prices to allow for the more current data to factor more prominently in future trends.
Mark's Tip