![]()
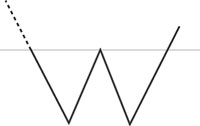 A double bottom chart will look like a “W.” It indicates that the stock hit bottom market price, had a quick – albeit brief – uptick, and decreased again to turn a “V” shape into a “W.” The two reverse peaks should be around the same floor price and the time period should be similar to create the fairly well-formed “W.”
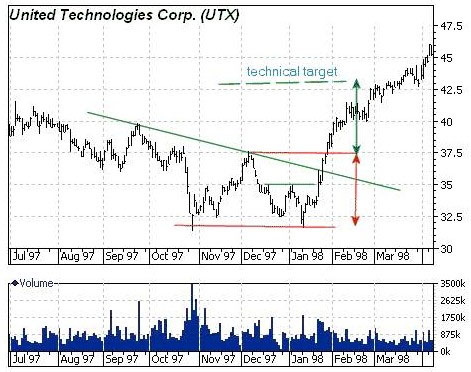
A Double Bottom is only complete, however, when prices rise above the high end of the point that formed the second low.
The two lows will be distinct. The pattern is complete when prices rise above the highest high in the formation. The highest high is called the “confirmation point”.
Analysts vary in their specific definitions of a Double Bottom. According to some, after the first bottom is formed, a rally of at least 10% should follow. That increase is measured from high to low. This should be followed by a second bottom. The second bottom returning back to the previous low (plus or minus 3%) should be on lower volume than the first. Other analysts maintain that the rise registered between the two bottoms should be at least 20% and the lows should be spaced at least a month apart.
Look at the chart below that shows a very well defined double bottom and then the ensuing rise: