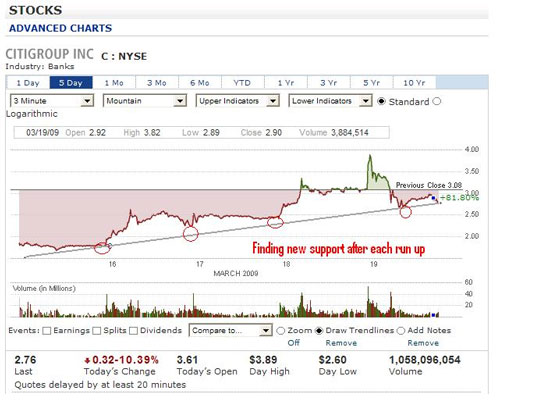
Support Support in a stock chart forms at an area where the stock’s price seems to not want to move lower. This is due to the presence of buyers at this lower target price. and resistance Resistance in a stock chart forms at an area where the stock’s price seems to not want to move higher. This is due to the presence of sellers at this higher price. are words used in the technical analysis universe. For reasons that are often difficult to quantify, market prices tend to “bounce” off the support and resistance levels that are established.
Support in a stock chart forms at an area where the stock’s price seems to not want to move lower. This is due to the presence of buyers at this lower target price. Support levels sometimes occur by themselves, while other times they are depicted with horizontal trend lines in chart patterns such as a double bottom. When support is broken to the downside, a stock is free to move lower due to the absence of buyers and demand.
Resistance in a stock chart forms at an area where the stock’s price seems to not want to move higher. This is due to the presence of sellers at this higher price.
Resistance levels sometimes occur by themselves, while other times they are depicted with horizontal trend lines in chart patterns such as a triple top pattern. When resistance is broken to the upside, a stock is free to move higher due to the absence of sellers and supply.
 However, during a “ breakout A breakout occurs when a stock’s price moves up quickly above former resistance levels. ” period, prices tend to fly by these former levels until new support or resistance levels occur. As an informed investor, you should attempt to learn the conditions that spurred the stock to increase/decrease beyond its former support and resistance levels to determine if it’s time to buy or sell the security. The support/resistance level is usually shown by a horizontal line across the chart making it easy for you to identify these levels.
