![]()
 During the height of the dot.com explosion, a popular strategy – growth at any price – became the rallying cry for many investors. After the bubble burst, a more conservative strategy known as growth at a reasonable price, or GARP, became and remains a popular investing action plan.
Paying a high price for a rapidly rising security can result in some serious losses if it cannot sustain its impressive growth. Take a look at the graph of Crocs (CROX) below. This is that plastic, colorful shoe company that became very popular a few years back:
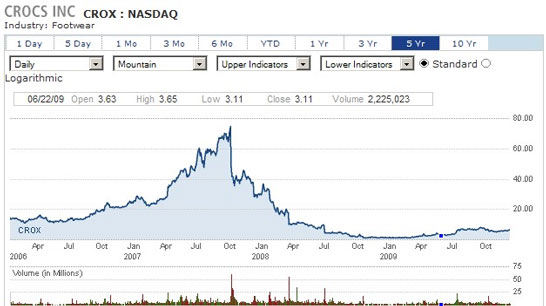
The chart above of Crocs, Inc. (CROX), shows us the risk of buying a high growth company too late.
Crocs is a great example of the risks of investing too late in a fast growing company. However, stocks growing at a more moderate, sustainable rate may be smart purchases because they tend to deliver more profit with less risk of major losses like the high flyers (CROX). Take a look at Google (GOOG) below. It is clearly a growth company and has been for years.
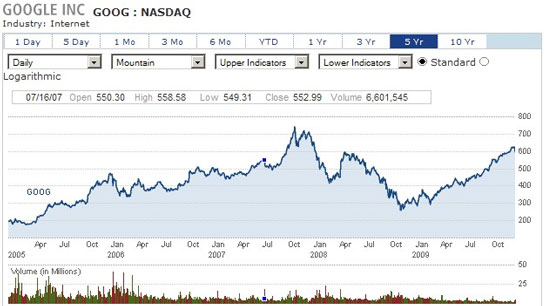
The graph of Google (GOOG)shows us how it has taken a few hits, but has a more sustainable growth rate and business.
Growth investing is similar to “value” investing as most people equate the ability to grow with the intrinsic value of a company and its stock. Growth at a reasonable price suggests you should value securities in relation to similar stocks, stocks that have experienced similar growth, but carry higher market prices.
For example, if you were interested in investing in big technology companies, you could use the GARP method to choose the fastest growing technology companies with the most reasonably priced stocks, relative to their profits and expected future rates of growth. Let’s look at
Microsoft (MSFT), Yahoo! (YHOO), Google (GOOG) and Apple (AAPL) using the GARP method.
| Stock | Price to Earnings (P/E) Ratio | Projected Earnings Growth (PEG) |
|---|---|---|
| MSFT | 19.7 | 18% |
| YHOO | 185.6 | 47% |
| GOOG | 38.5 | 30% |
| AAPL | 33.5 | 50% |
Looking at the relative PE ratios and PEG ratios above, we see that Microsoft has the smallest valuation (a PE of just 19.7). But it also has the smallest projected growth rate (just 18%), which probably explains why it is a relatively cheap stock compared to its peers.
On the other hand, Yahoo! has a crazy, sky-high PE ratio of 185.6 and a very high projected earnings growth rate of 47%. Google and Apple also have high PE ratios, but nothing like Yahoo’s. Their projected earnings are also better than Microsoft’s: 30% and 50% verses just 18%.
So far, we can see that in this comparison, Google and Apple deliver very good growth without an expensive price tag. That eliminates Microsoft and Yahoo! from consideration, but how do we choose between Google and Apple?
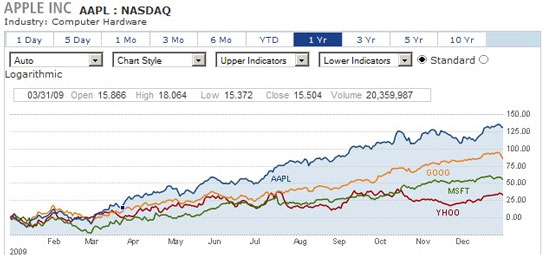
Since Apple has better growth prospects (50% vs. 30% growth) and a cheaper valuation to Google’s (33.5 vs. 38.5), it is our clear winner in this GARP analysis. Not surprisingly, Apple was one of the best stocks to own in 2009 as it returned more than 120% to investors who owned it. And looking at a chart of all 4 stocks we considered above, it may be tempting to assume that everyone used the GARP method to pick stocks in 2009:
In 2009, Apple gained more than 125%, Google 80%, Microsoft 50% and Yahoo! just 30%
Of course, the quality of a GARP analysis is dependent on the projected future earnings for a stock and these can change at any moment. Still, GARP analysis is helpful in choosing between stocks in the same industry because if earnings projections change for one company, they also usually change for every stock in that industry.
Don’t worry if you’re not right on every occasion; no one is. But, making smart decisions based upon solid research and reasonable expectations should return good profits over time.