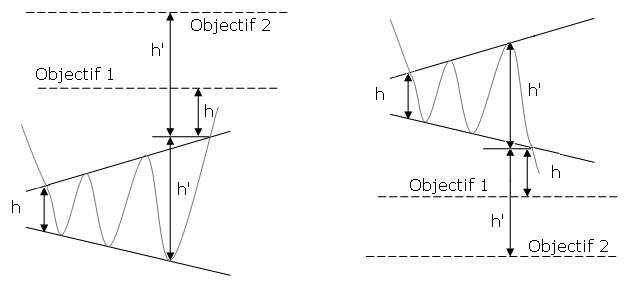
The symmetrical broadening bottom is a bullish reversal pattern. The pattern is formed by two symmetrical horizontal lines that are divergent. So it is a inverted symmetrical triangle or an open triangle. The oscillations between the two bands of the triangle are therefore becoming more and more sizable. Each line must be touched at least twice for validation.
The symmetrical broadening bottomshows the growing nervousness of investors but also their indecisiveness. If the pattern is not identified quickly, the movement may seem totally random and thus trapping many investors.
The formation of this pattern should be preceded by an upward movement. This pattern is often due to cheap purchases that will form new highs. However, selling pressure remains strong and the indecisiveness is dominating.
The target price is given by plotting the height of the triangle at its start on the breakpoint. Another technique is to extend the maximum height of the triangle on the breakpoint.
Here is a graphical representation of a symmetrical broadening bottom:
The associated figure shows an example of a broadening bottom chart pattern on the daily scale. Price begins the broadening bottom at A and forms diverging peaks and valleys. At the end of the broadening bottom, C, a partial decline occurs which correctly predicts an upward breakout. This allowed astute traders early entry.
Notice that if you draw the top trendline to connect point B instead of C, the pattern would take on the appearance of a right-angled and descending broadening formation because the top trendline would be flat or nearly so. Also, price at E bounces to D and then makes a lower low at F. Point D looks like a partial rise which fails when the predicted breakout at F does not occur. This is one example of why trading broadening bottoms for profit is difficult, even if relying on a partial decline or partial rise.

