
Just like we all care about our personal health, managers and investors care about the health of their company. How can they perform a “check-up” on their business in order to determine its progress and financial health? Instead of weight or blood pressure, analysts use financial ratios.

Future Options are exactly what their name implies – an option on a futures contract.

The balance sheet is a financial snapshot of the firm on a specific date – specifically their assets, liabilities, and shareholder equity
The Income Statement is one of the financial statements that all publicly traded companies share with their investors, which shows the company’s sales, expenses, and net profit (or loss) over a period of time–usually 3 months, year-to-date, and twelve months.

Fibonacci Arcs and retracements are used as a technical indicator to determine support and resistance. As with most indicators it can be used to see if a breakout has occurred or if a reversal is likely to happen.

“Asset Allocation” is how you have divided up your investments across different assets. You can have all your assets in one place, or you can use diversification to spread them around to reduce risk.
In finance, Volume-Weighted Average Price (VWAP) is a ratio of the profit traded to complete volume traded over a distinct time horizon – normally one day. It’s a portion of the average price a stock traded at over the trading horizon.
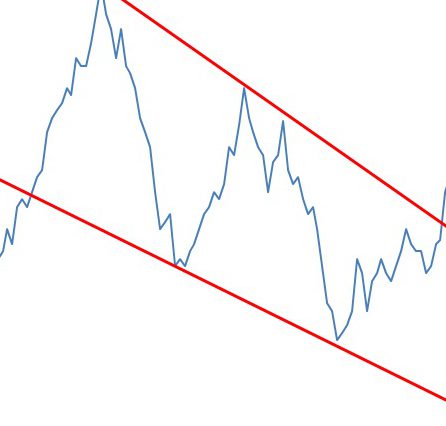
A pullback is a technical analysis term used frequently when a stock “pulls” back to a resistance and/or support line, usually after a breakout has occurred.
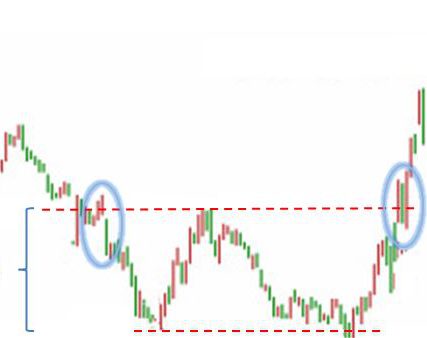
Double Bottoms are reversal patterns and often seem to be one of the most common (together with double top patterns) patterns for currency trading. Double Bottoms patterns are identified by two consecutive low prices of the same depth with a moderate pull back up in between (neckline peak).
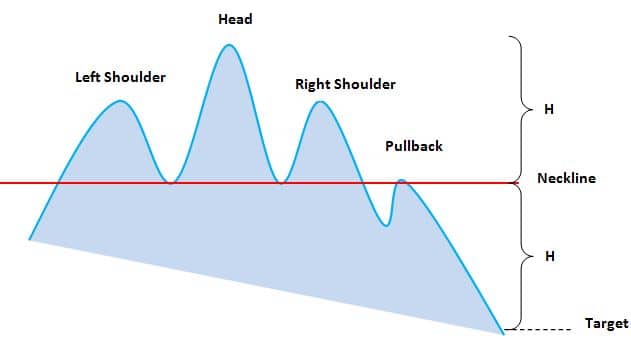
The head-and-shoulders pattern is one of the most popular chart patterns in technical analysis and indicates that a reversal is likely to happen after the pattern has been completed.

The Moving Average Convergence-Divergence (MACD) indicator is one of the easiest and most efficient momentum indicators you can get. The MACD moves two trend following indicators and moving averages into a momentum oscillator by subtracting the longer moving average from the shorter moving average. The result is that the MACD gives the best of both worlds: trend following and momentum.

The Black-Scholes formula is the most popular ways to calculate the “true” price of an option.

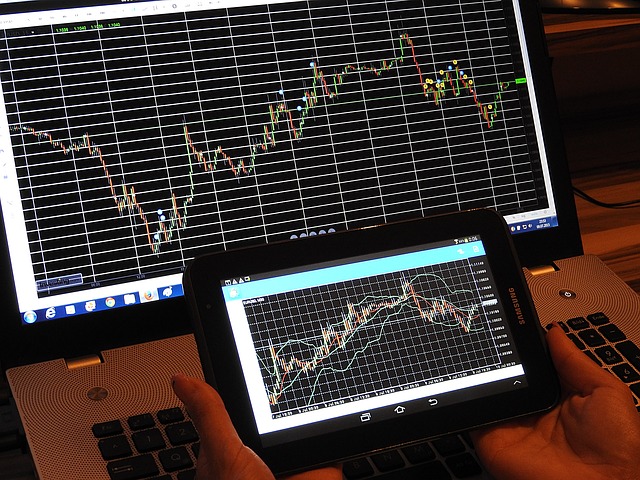
Technical analysis software automates the charting, analysis and reporting functions that support technical analysts in their review and prediction of financial markets (e.g. the stock market).
Serbia is a European country with an upper-middle income economy. It had one of the fastest growing economies of its region, in terms of GDP growth rates prior to the global recession, and attracted solid foreign direct investment. This article explores Serbia’s economic strengths along with the stock market, largest banks and ways one can invest in the country.

A cup-and-handle chart pattern resembles a cup of coffee. These are bullish continuation patterns where the growth has paused momentarily, it trades down and then continues its upward pattern. This pattern must always be at least 5 weeks long and can last up to a year. Click on this post to learn more.

Latvia is an EU member country that experienced superior GDP growth rates prior to the financial crisis in 2008. It underwent significant privatization, which resulted in large foreign direct investment inflows. Its economy was ranked first among developing countries until 2008. Click here to read about the main Latvian industries, exchanges, and more!

Belgium is an EU member located in Western Europe. It has a strong industrialized economy, well-developed transportation infrastructure, and a highly productive work-force making it an attractive destination for foreign capital. Read this post for information on Belgium’s main industries and exchanges, as well as ways to invest in Belgian companies!

Italy is an EU member country and one of G-8 leading industrialized economies, having the seventh largest economy in the world. Its thriving small and medium enterprises play an important economic role.

Ireland is an EU member country with a knowledge-based economy and strong industries in services and technology. With attractive corporate tax rates, Ireland has been ideal destination for multinational corporations. Read this post for more information on Irish industries, exchanges, ways to invest in Ireland, and more!

Hungary is an EU member country with a medium-sized, liberal economy that is rapidly developing. It has the 5th largest economy in Central and Eastern Europe, with major exports in machinery, chemicals, textiles, and agricultural products. Read this article for more information about Hungarian industries, exchanges, and more!

Peru is a Latin American country with an emerging, market-oriented economy that has been among the top performers in South America. Rich in natural resources, it is a major exporter of gold, copper, zinc, and fish. Click on this article for more information about Peruvian industries, exchanges, and more!
Portugal is an EU member country with a high-income and service-based economy. It enjoys vast forests, has a strong industrial base, and is an important agricultural exporter. Read this article for information about Portuguese industries, exchanges, and more!
Romania is an EU member country, which has experienced positive foreign direct investment and GDP growth following privatisation initiatives over the last decade. It has an upper-middle income economy strong in its industrial and agricultural sectors. This article contains information about Romanian exchanges, and ways to invest in Romania.
Argentina is a South American country that is one of the G-20 economies. It is the third largest economy in Latin America and has the highest GDP per capita in its region. It possesses plenty of natural resources, a strong agricultural sector, and a well-educated population. Click on this post for information about Argentina’s main industries, main exchanges, and ways to invest in Argentina!
Albania is one of south eastern European countries that have shown promising economic growth potential. It has been increasingly attracting foreign direct investment and possesses a strong agriculture and natural resources industry. Read this post for more information about Albania’s main industries, stock exchanges, 10 most profitable countries, and more!

Free Cash flow is the cash available to all the capital providers of a company. There are two types of free cash flows: 1) Cash flow available to pay out to all capital providers and 2) Free Cash Flow to Equity (FCFE).

The Form-8K is a SEC-mandated report filed by public companies to report unexpected events or transactions that are material in nature, and thus have an impact on the share prices of the company.

Fixed income analysis is the process of evaluating and analyzing fixed income securities for investment purposes. Read this article to discover the elements of fixed income analysis.

Financial modeling is the creation of a program or structure designed to incorporate a company’s financial information and projections, and subsequently come up with a valuation used for investment decision making. Read this article to learn about its uses and the key elements in financial modeling.

Discounted Cash Flow (DCF) is a valuation technique or model that discounts the future cash flows of a business, entity, or asset for the purposes of determining its value.

The Debt-Snowball Method is a debt-management strategy aimed at reducing a borrower’s obligations. Borrowers can use this method to slowly eliminate their debt by focusing on their smallest debt balance, followed by larger ones until all obligations are paid off. Click on this post to read about the steps included in the debt snowball method, the rationale behind it, and the disadvantages of using it.
Covariance is a statistical measure of the extent that 2 variables move together relative to their respective mean (or average) values.
The Collar Option Strategy is designed to limit the downside risk of a held underlying security. It can be performed by holding a long position in a security, while simultaneously going long a Put and shorting a Call. Read this article to read details of the strategy and to see a profit/loss example.

Cash Conversion Cycle is defined as the length of time (in days) needed to transform inventory purchases into actual cash receipts. It takes into consideration the company’s time commitment towards collecting receivables and paying its suppliers, and is an important measure of a company’s internal liquidity.

Account Receivables Management refers to the set of policies, procedures, and practices employed by a company with respect to managing sales offered on credit. If efficient, receivables management can lead to good sales growth, healthy cash flows, profitability, and stable operating cycles.

Account Payables Management refers to the set of policies, procedures, and practices employed by a company with respect to managing its trade credit purchases. It is an important working capital amount that can enhance a company’s short-term cash flow position.

A straddle is an investment strategy that involves the purchase or sale of an option allowing the investor to profit regardless of the direction of movement of the underlying asset, usually a stock. Read this article for details on the two straddle strategies: a long straddle and a short straddle.

Modern Portfolio Theory (MPT) is an investment theory whose purpose is to maximize a portfolio’s expected return by altering and selecting the proportions of the various assets in the portfolio. This article discusses the assumptions of MPT, and its limitations.

Duration measures the percentage change in the price of a bond (or value of a bond portfolio) due to a change in market interest rates (also known as the yield).
Return on Equity (ROE) is one of the most important pieces of data that investors and creditors use to evaluate a company’s potential to grow and profitability. Dupont Analysis breaks the ROE into several different components in order to analyze where the returns are coming from.
Depreciation refers to the gradual and permanent decrease in value of the assets (referred to as a depreciatable asset) of a firm, nation or individual over its lifetime.
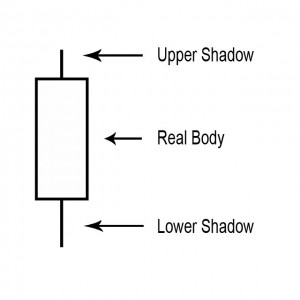
The body of the candlestick chart is the most basic building block for a candlestick chart. Read this article to learn more!
A point on a candle stick chart representing a specific time period (a day, an hour, a minute, etc) in which the underlying stock price has moved. Candlesticks will have a body and usually two wicks – one on each end.
A shadow is the small line (like a candle wick) found at the top or bottom of an individual candle in a candlestick chart.
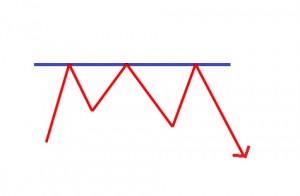
The Resistance Line is a point or range in a chart that caps an increase in the price of a stock or index over a period of time.

The price-to-sales ratios (Price/Sales or P/S) take the company’s market capitalization (the number of shares multiplied by the share price) and divide it by the company’s total sales over the past 12 months. The lower the ratio, the more attractive the investment.
Price/Earnings To Growth, is a valuation metric for determining the relative trade-off between the price of a stock, the earnings generated per share (EPS), and the company’s expected future growth. It can be useful when looking at the future earning growth.
A series of technical indicators used by traders to predict the direction of the major financial indexes. Most market indicators are created by analyzing the number of companies that have reached new highs relative to the number that created new lows, also known as market breadth. By weighing those indicators showing Bullish signs against those showing Bearish signs, you are able to weigh your risk in the current market. Read this article for a list of the best market indicators!

A national government that owes money to international financial institutions such as the World Bank, foreign governments, or to foreign lenders.

Advance/Decline Index is a technical analysis tool that represents the total difference between the number of advancing and declining security prices. This index is considered one of the best indicators of market movements as a whole.