
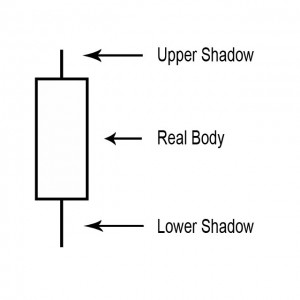
A small line (like a candle wick) found at the top or bottom of an individual candle in a candlestick chart. The shadow illustrates where the price of a stock has fluctuated relative to the opening and closing prices. A shadow can be located either above the opening price (upper shadow) or below the closing price (lower shadow). These shadows illustrate the highest and lowest prices at which a security has traded during a specific period of time. When there is a long shadow on the bottom of the candle (like that of a hammer) there is a suggestion of an increased level of buying and, depending on the pattern, potentially a bottom.