Definition
Volume-Weighted Average Price (VWAP) is often used as a trading benchmark by traders, pension funds, mutual funds and market makers. It can allow traders to get a sense of how successful they were in obtaining a good price. A buy order filled below the VWAP would be considered a good trade.
Using VWAP
A lot of people will wonder why not just use the average price, it’s a lot easier to calculate and isn’t it essentially the same thing anyway? As we can see, the difference is that it tracks volume as well. By tracking volume you also get information about liquidity as well as the amount of money that traded, not just the price.
Calculation
VWAP calculation can vary greatly depending on the time frame and time horizon you choose, as well as the price calculation. However, VWAP is typically used within one trading day and uses a one minute time frame.
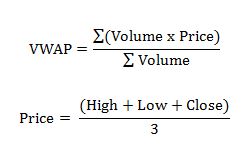
The formula for VWAP is:
The price can be used as the last price in a time frame or the price calculated using the high, low and close in a given time frame. Here is an example of the calculations:
| Volume | Price | Price * Vol | Time | VWAP 1 min |
|---|---|---|---|---|
| 20 | 10.15 | 10.15*20 = 203 | 9:30 | 203/20=10.150 |
| 30 | 10.21 | 10.21*30 = 306.3 | 9:31 | (203+306.3)/(20+30)=10.186 |
| 75 | 10.22 | 75*10.22 = 766.5 | 9:32 | (203+306.3+766.5)/(20+30+75)=10.206 |
We can see from the calculations that the VWAP is cumulative and thus a price at the beginning with high volume will have more effect than a price at the end of the day, since it is now just a drop in all the trades placed over the day. It would take a very large volume and/or price change to change the VWAP at the end of the day (depending on the time frame you use). Another important thing to notice is the time frame, a smaller time frame (such as every trade or tick) will be more accurate, but for a stock that trades a lot this could be data for 50,000 trades. If you are doing multiple stocks, this could easily slow down or even crash your computer if you started storing and calculating enough days.
Graph
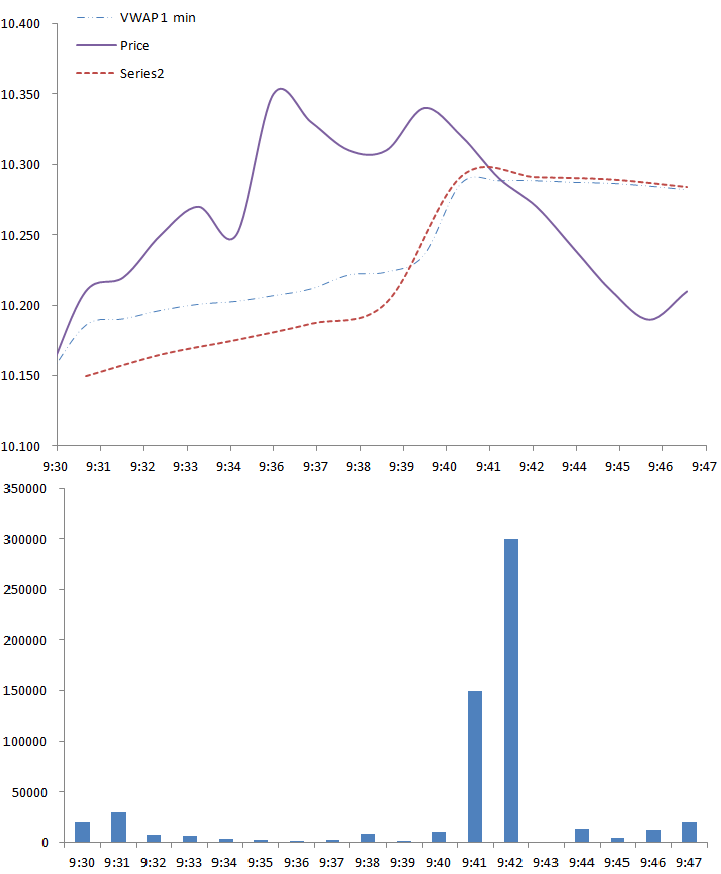
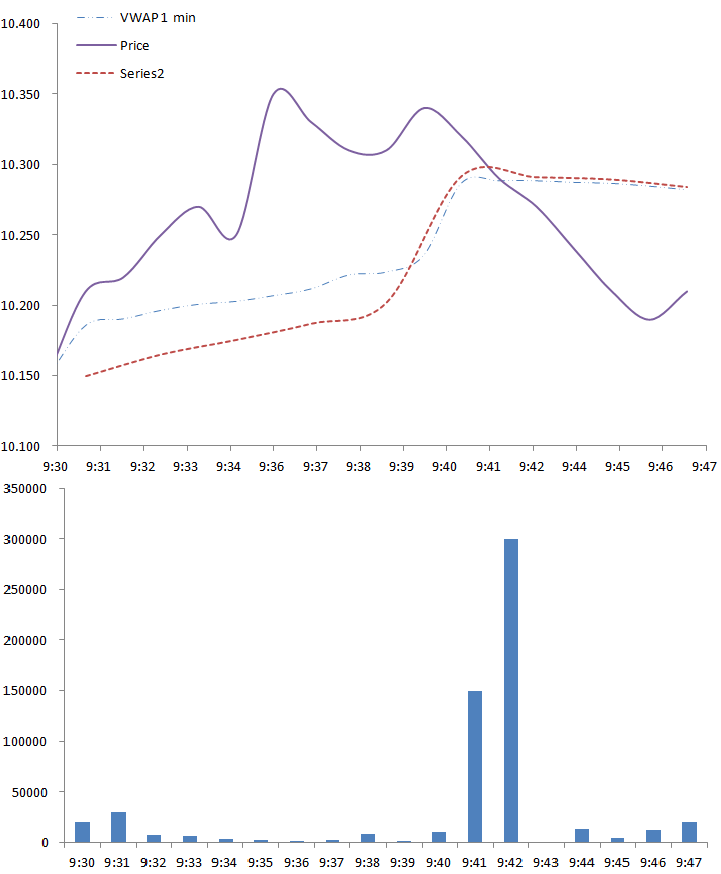
The greatest change in the results and calculation of VWAP is the time frame. If we look at the difference below between a 1 minute time frame and a two minute minute time frame we will see there is a discrepancy.


As we can see the two minute does not follow as closely as the 1 minute since it is only “checking” the price every two minutes.
Another ratio we can use similar to VWAP is the moving VWAP (MVWAP) that is similar to a simple moving average. This will use a different period and will sometimes be carried over from day to day depending on the period used. Essentially, instead of starting at one day, we will calculate our MVWAP using the data over the period we wish to study. For example, we can say we wish to take a period of 10 minutes and thus we will essentially have a VWAP that started it’s “day” ten minutes before.

