![]()
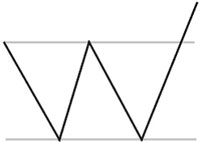 A breakoutA breakout occurs when a stock’s price moves up quickly above former resistance levels. occurs when market prices move through and continue through former highs/lows that had formed ceilings or floors in the past. Commonly called levels of “ support Support in a stock chart forms at an area where the stock’s price seems to not want to move lower. This is due to the presence of buyers at this lower target price. ” and “ resistance Resistance in a stock chart forms at an area where the stock’s price seems to not want to move higher. This is due to the presence of sellers at this higher price.,” these former limits are breached during a breakout. This chart is rather easy to understand as you see historic peaks and valleys that are fairly consistent, when suddenly the most recent trendline quickly moves up or down toward new highs/lows.
The duration of the trading range for which the breakout occurred can provide an indication of the strength of the breakout to follow. The longer the duration of the trading range, the more significant the breakout will be.
A classic breakout occurred for Gold (GLD) in autumn 2009. After twice getting halted at about $1,000/oz ($100 for the ETF GLD), gold blasted through this resistance level as can be seen in this 3-year chart:
