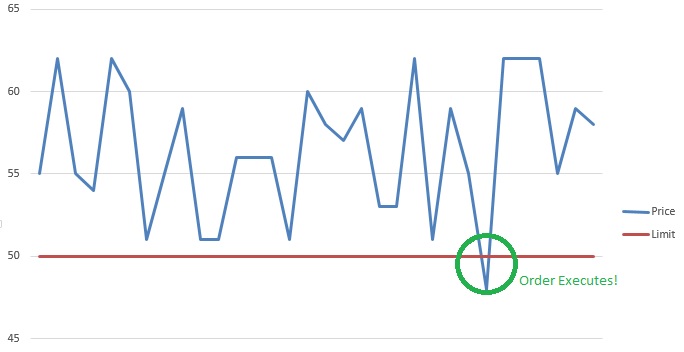
Definition: Trailing Stop is a Stop Loss order which is placed as a percentage value as opposed to an absolute dollar value. The order will only execute if the price of the security falls by a certain percentage. The trailing stop adjusts automatically as the price of the security rises and bases itself on the new appreciated value. This type of order allows profits to be made while cutting losses simultaneously.
Explanation: This is such a useful tool, yet many fail to use it. Using a trailing stop allows you to let profits run while cutting losses at the same time.
Definition: Margin buying is buying securities/stocks with money borrowed from a broker. Since this money is borrowed, margin buying can multiply profits or losses made on the securities. The stocks/securities are used as collateral for the loan.
Explation: The broker will have a set minimum margin requirement which is the maximum percent of the investment that can be paid for with margin/borrowed money. A Margin Call is when the value of your investment drops your equity in the investment below the requirements of the broker at which time you have to add more money to your account or sell the security.
Definition: Current Ratio is the ratio of current assets divided by current liabilities. It provides A liquidity ratio that measures a company’s ability to pay short-term obligations. Also known as “liquidity ratio”, “cash asset ratio” and “cash ratio”. The Current Ratio formula is:
Example: The ratio is mainly used to give an idea of the company’s ability to pay back its short-term liabilities (debt and payables) with its short-term assets (cash, inventory, receivables). The higher the current ratio, the more capable the company is of paying its obligations. A ratio under 1 suggests that the company would be unable to pay off its obligations if they came due at that point. While this shows the company is not in good financial health, it does not necessarily mean that it will go bankrupt – as there are many ways to access financing – but it is definitely not a good sign.
Current ratio = Current Assets / Current Liabilities.
The current ratio can give a sense of the efficiency of a company’s operating cycle or its ability to turn its product into cash. Companies that have trouble getting paid on their receivables or have long inventory turnover can run into liquidity problems because they are unable to alleviate their obligations. Because business operations differ in each industry, it is always more useful to compare companies within the same industry.
This ratio is similar to the acid-test ratio except that the acid-test ratio does not include inventory and prepaids as assets that can be liquidated. The components of current ratio (current assets and current liabilities) can be used to derive working capital (difference between current assets and current liabilities). Working capital is frequently used to derive the working capital ratio, which is working capital as a ratio of sales.
Buy-side Firms are companies that provide advice on buying stocks and securities for use within their own organizations.
Examples of buy-side firms are mutual funds, pension funds and hedge funds. These firms provide recommendations about upgrades, downgrades, target prices and opinions within the company itself. These firms which are also called non-brokerage firms, work exclusively for the company’s own money and not for outside investors. Buy Side firms are not to be confused with Sell-Side firms.
Analysts in buy side firm are independent with little or no conflicts of interest due mainly to the Chinese wall.
Roles and Responsibilities of Buy Side Firms
Buy side firms, do their own research and buy securities for the company’s own projects
Buy-side analysts work with portfolio managers within their organization which makes it easy to explain their analysis
fixed-income buy-side analysts grade high yield bonds used for their company’s review and benefit
Limitations of Buy Side Firms
Buy side firms can not involve external investors in trading based on their research
They are restricted from brokerage activities for investors and earning transaction costs and brokerage commissions
Buy-side analysts are prohibited from releasing any private recommendations
Investment costs and losses while buying securities are covered by the buy-side firm and cannot be outsourced.
Examples of Buy-Side Firms
Some examples of Buy-Side Firms are:
Fidelity Funds
Putnam Funds
Vanguard Funds
T Rowe Funds
Conclusion
Buy side firms typically engage in trading investments and generating profits/losses using only their own resources.
These firms do not buy and sell investments for public traders.
DefinitionThe Asset to Equity Ratio is the ratio of total assets divided by stockholders’ equity.
The asset/equity ratio indicates the relationship of the total assets of the firm to the part owned by shareholders (aka, owner’s equity). This ratio is an indicator of the company’s leverage (debt) used to finance the firm.
The importance and value of the company’s asset/equity ratio is dependent upon the industry, the company’s assets and sales, current economic conditions, and other factors. There is no ideal asset/equity ratio value but it is valuable in comparing to similar businesses. A relatively high ratio (indicating lots of assets and very little equity) may indicate the company has taken on substantial debt merely to remain its business. But a high asset/equity ratio can also point to a company that is wisely “trading on the equity.” In other words, there is a high asset/equity ratio because the return on borrowed capital exceeds the cost of that capital.
At some higher levels, however, the ratio can reach unsustainable levels, as the additional debt ratchets up interest costs and the deteriorating financial position puts the firm in jeopardy. By the same token, a low asset/equity ratio can indicate a strong firm that needs no debt, or an overly conservative company, foolishly foregoing business opportunities.
Today, you can find many articles warning of an imminent market pull back. As a new investor, it is helpful to understand how the various indicators contribute to these forecasts so that you will be forewarned and can make appropriate alterations to your portfolio before a bottom drops out. Those who are unprepared often pay a large penalty.
Current Events
Lets first look at current events. There is a very strong correlation between these events and the near term direction of the market. This week, there were reports that the job market and service sectors are in worse shape than predicted. The Eurozone economy, which has dominated the financial press, is continuing to unravel. Debt, driven by the US government, as a percent of GDP is more than 10 times higher today than it was prior to the great collapse of the 20’s. Market fear from these events can quickly stall the economy. While our economy is so shaky, our government ignores the historical lessons of our prior recessions. Obama has just release new guidelines for federal programs that will 1) remove capital from the market, 2) encourage people with weak credit ratings back into home ownership and 3) increase business uncertainty, risk and fear. The economic stall can be associated with any random event with all these other issues bearing down.
Beside specific current events, we know that seasonality has an impact on specific stock sectors as well as the market in general. Our “Best Months to Buy” article reported that May, June, August, September and October are historically the worst months of the year to hold stock.
Technical Indicators
For many, technical indicators are hard to understand so are overlook. In fact, using these tools are quite easy as they are readily available on the web. We just need to understand what they mean. Lets look at what some of these indicators are saying about our current economy and the market.
As most of us know, the most popular market indexes are hitting record highs but with lower volume. As you may remember from our previous article, volume is the most important early warning indicator for predicting changes in demand and the direction of price.
Avid technical analysts use the MACD as one of the most accurate indicators. Today when you look at the MACD for the DOW, you will see that it is converging and heading toward a bearish crossover. This is a very strong technical indicator predicting a downturn in the market. If the two lines used for MACD continue in their path and cross over, you will find that the smart investors will quickly leave uneducated investors holding the bag.
Finally, there have been five distribution days over the last month. A distribution day is when the market has a big loss with large volume. When you have five distribution days, then these analysts specify that the market moves from a confirmed up trend to a confirmed down trend. Some stock picking companies use this one indicator as the sole tool in choosing market turns. To see a complete list of technical indicators.
In next week’s newsletter, I will write about how to adjust your portfolio when you have identified an upcoming down turn.
Moving Averages are one of the most popular and important technical analysis tools. The ease of use and simple calculation make it a great tool to get information quickly. They also provide the basics for more advanced technical analysis tools like MACD and Bollinger Bands and can be useful for removing some of the “noise” from daily fluctuations in the market. In simple terms, the moving average is an average that compares the previous period over time. There are two types of moving averages: the Simple Moving Average (SMA) and the Exponential Moving Average (EMA) which puts more weight on the latest date. We will explore the differences more in depth later on.
Moving Average Technical Analysis
Moving Averages are lagging indicators and give an indication of the strength of a trend rather than predict movement in the asset or market. They are also useful for identifying support and resistance lines and can be used to look at a market reversal. As we will see below, the longer the period used for the SMA, the stronger the trend, hence a 200 day SMA provides a stronger indication of trend than a 10 day SMA.
Moving Averages give a lot of information at crossings between shorter and longer Moving Averages, the distance between the price and the moving average and provide support and resistance lines as well.
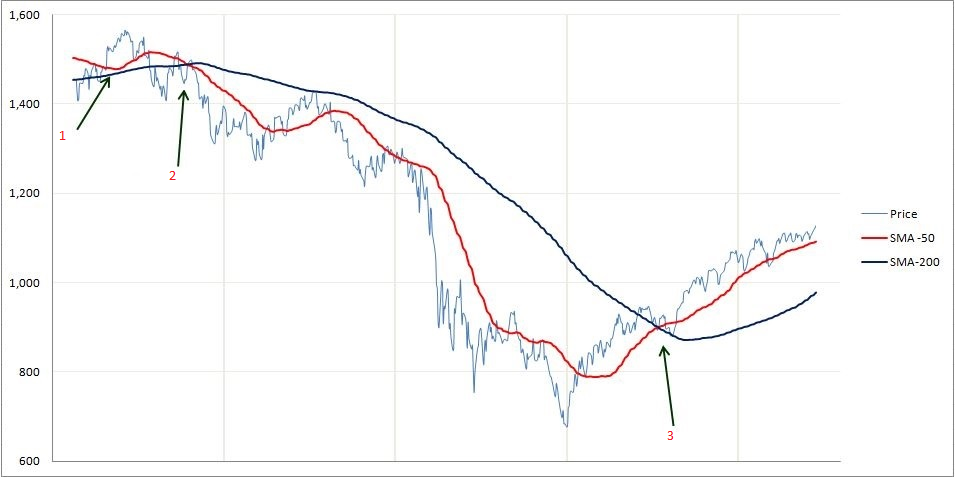
Below is a graph with a 50 day and 200 day SMA.
The first thing to point out is that the 50 day SMA follows the price much more closely than the 200 day SMA. Hence the longer the period of the SMA, the smoother and more static the line is. As an analogy the 10-day SMA is like a sports car that can turn quick and easily whereas the 200-day SMA is like a large truck that cannot change or turn quickly.
Take note of the points where price and SMA’s or EMA’s cross each other. If we start with the leftmost arrow (1), we can see that the price crosses the 50 day and 200 day multiple times. This is not a strong indication of trend, as the price can frequently give “false” warnings in day to day trading.
A much stronger indication is when a shorter period SMA crosses a longer period SMA. As we can see at the second arrow (2). The 50 day SMA crosses the 200 day SMA from the top (downward) which is a strong indication of a bear market.
On the other hand, the third arrow (3) has the 50 day SMA crossing the 200 day SMA from the bottom (upward) giving a strong indication of a bull market.
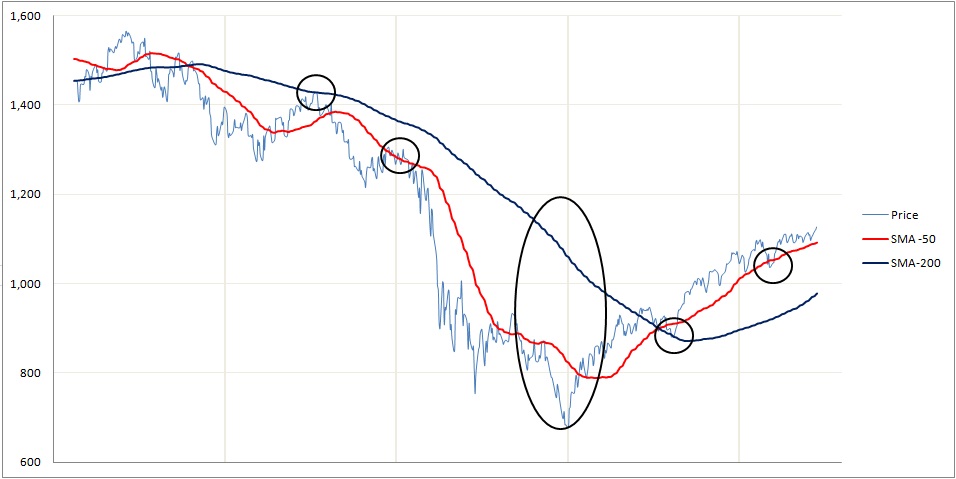
Another aspect we can see from moving averages is the support and resistance lines. Support lines are when the moving average is below the price and resistance lines are when the moving average is above the price. As we can see from the multiple small circles, the price rarely goes above or below the moving averages for long and even less frequently when it is a longer period. The other thing to notice is the large oval. The greater the distance between a moving average and the underlying price, the more we can expect a reversal of the current trend as we can see above.
!!! Note: These indicators can be useful to determine resistance, support, some reversals and trend strength. However, as you can see from the top left in the graph, this is not always the case. The 50 day SMA came very close to crossing the 200 day average but would not have indicated a very strong trend!
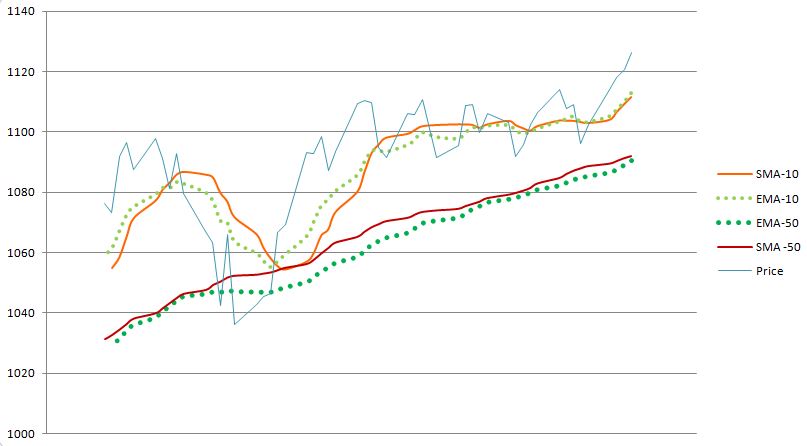
SMA vs EMA
As we saw earlier the EMA gives more weight to the current price which we will see in more detail in the calculation section.
You can see slight discrepancies above between the EMA and SMA. With a price that has more volatility however, you will see greater differences. We can also see that there the EMA tracks some big changes more closely, especially for the EMA that is 10 days as opposed to 50 days.
Moving Average Calculations
The Simple Moving Average calculation is far more straight forward than the Exponential Moving Average Calculation.
SMA calculation:
N Day SMA: Is the sum of N previous closing prices over N where N is the number of Days considered.
For example: 20 Day SMA is the sum of the closing prices of the 19 previous days(includes today’s closing) over 20.
If we have a 5 day SMA with prices as follows:
Jan 1st
12.5
Jan 2nd
13.7
Jan 3rd
14.5
Jan 4th
13.9
Jan 5th
16.8
Then the 5-Day SMA on the 5th of January is: (12.5+13.7+14.5+13.9+16.8)/5 = 14.28
!!! You always need the number of days data before you can calculate that day’s Average! So if you want the 200 day SMA for a particular day you need 200 days of data before that!
Mathematical Formula:
(Σ closing price from i-N to i) / N where i is the current day and N is the time period.
EMA calculation:
The EMA is a more complex calculation, though, as we have seen, just as easy to interpret.
EMA = (current Price * 2/(1+N)) + (Previous Day’s EMA * (1-2/(1+N))
The expression 2/(1+N) is called the weighting multiplier and will be higher for smaller periods of EMA. This means that more weight will be given to the last day’s price.
SMA VS EMA
Price
SMA-5
EMA-5
19
17
17
20
18
18
50
24.8
28.67
22
25.8
26.44
23
26.8
25.3
From the table above we can see from the red number in the table, the EMA is much higher than the SMA. This is because the EMA will more closely follow the last price change.
A dollar Trailing Stop is a Stop Loss order which is placed as a dollar value. The order will only execute if the price of the security falls by that dollar amount. The trailing stop adjusts automatically as the price of the security rises and bases itself on the new appreciated value. This type of order allows profits to be made while cutting losses simultaneously.
A zero coupon bond is a bond sold without interest-paying coupons. Instead of paying periodic interest, the bond is sold at a discount and pays its entire face amount upon maturity, which is usually a one year period or longer. A Treasury Bond is a good example.
Yield To Maturity is the interest rate that will make the present value of a bond’s remaining cash flows (if held to maturity) equal to the price (plus accrued interest, if any). It is basically what you will earn if you buy and hold the bond till maturity. On of the major assumptions is that all the coupons are re-invested at the YTM.
Unsystematic Risk is also called diversifiable risk, residual risk, or company-specific risk. It is the risk that is unique to a company such as a strike, the outcome of unfavorable litigation, or a catastrophe that affects its production. This risk can be mitigated away by diversification.
Treasury bills, often referred to as T-bills, are short-term securities (maturities of less than one year) offered and guaranteed by the federal government. They are issued at a discount and pay their full face value at maturity.
A percentage Trailing Stop is a Stop Loss order which is placed as a percentage value as opposed to an absolute dollar value. The order will only execute if the price of the security falls by a certain percentage. The trailing stop adjusts automatically as the price of the security rises and bases itself on the new appreciated value. This type of order allows profits to be made while cutting losses simultaneously.
S&P 500 Index (Standard and Poor’s 500 Index) is a composite of the 500 most actively traded public companies in all ten economic sectors of the U.S. It is maintained by Standard and Poor’s, a division of the Parent company McGraw-Hill.
Selling Short is a trade in which the investor borrows a security and sells it to another investor in the market. To close the short position an investor has to cover (purchase the same security from the market) and return it to the person they borrowed it from.
Pink Sheets refer to the trading of stocks that are not listed on a major exchange or the OTCBB due to a lack of minimum listing requirements or filing financial statements with the SEC (Securities Exchange Commission)
Out-Of-The-Money refers to an option that is unfavourable to exercise. An example is a put option with a strike price lower than the underlying stock price, or a call option with a strike price higher than the underlying stock price.
An Options Contract is a contract which specifies how much of the underlying asset can be bought or sold at a specific price. An option contract to buy the underlying is a call option, and to sell the underlying is a put option. Most stock options contracts represent 100 underlying shares.
Market Risk is the general risk for investing in the any security. Every industry in the market is affected by this risk. Examples of market risk: depression, war, inflation etc.
Initial Public Offering, or IPO for short, represents the first opportunity for the public to purchase shares of a company. It is also referred to as a private company “going public”.
Futures Contracts are a standardized, transferable legal agreement to make or take delivery of a specified amount of a certain commodity, currency, or an asset at the end of specified time frame. The price is determined when the agreement is made. Future contracts are always marked to market.
Discount refers to the price of a bond when it is below its par value. An example is if the par value of the bond is $1,000 and the bond is selling for $980, the bond is selling at a discount of ($1,000 – $980) =$20.
Derivative is a type of security whose value is “derived” from an underlying asset. (Eg; Futures and Options).
Futures and options are both derivatives – meaning a security whose value solely depends on the value of the underlying asset.
A future derives its value from the commodities or currencies which it represents
An option derives its value from the underlying stock
Futures and options were indistinguishable for most of recorded history – the first example of a derivative trade is from Plato, commenting on an investor who purchased the rights to use olive presses before a harvest, then resold the rights afterwards.
In the 19th century, futures became standardized and regulated in the United States, as they were an essential part of the agriculture market (which is why Futures are traded out of the Chicago Mercantile Exchange in the Midwest, as opposed to New York). Options were standardized later, in the fallout of the stock crash and the Great Depression.
Currency Risk is the risk an investor is exposed to when investing in international markets. Currency risk is mainly associated with the fluctuations in exchange rates of the various world currencies.
A Contract is term that describes the unit of trading for a stock option, future option or future. It lists all the obligations and particulars related to the security.
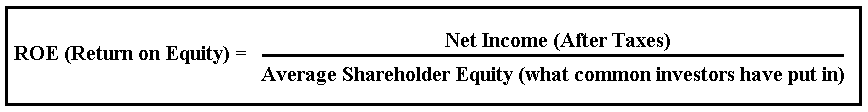
What are they doing with your money? Have you ever wondered how well your money is really being managed by the corporations you hand it over to?
After all, the media is full of stories about CEO compensation reaching new heights, buy-outs of non-profitable holdings, million dollar birthday parties and other horror stories.
Formula for ROE
What is ROE used for?
Return on Equity (ROE) is used to measure how much profit a company is able to generate from the money invested by shareholders.
Think of this way; if your friend asked to borrow $1,000 to start-up a small side business then chances are you would comply. When they came back to ask for $10,000 you would examine how well they performed with the initial $1,000 before making the next loan.
It makes such good sense that you might wonder why more people don’t use this handy little measure before pouring massive sums into a money pit masking as a company.
What kind of ROE to look for
Join the ranks of those in the know. ROE is easy to compute and provides valuable insight into the workings of the company.
Think twice before investing in a company with a negative ROE. Instead, search out self-sustaining companies with a healthy ROE that indicates the willingness and ability to use invested dollars for future growth rather than operating expenses.
A good ROE is 15% or better so keep your eyes – and ears – open for opportunity.
DuPont Analysis and the need to break down ROE
ROE measures what kind of income can be generated for a given level of equity injected into the company. It is essential to understand that different sections of the company that return is generated from.
This in turn will help investors identify where their equity is being used wisely, and where it is being wasted in trying to generate income.
You need to perform a DuPont Analysis to identify where equity is going and returns are coming from.
EPS (Earnings-Per-Share) measures how much of a company’s net income actually trickles down to each outstanding share.
Any preferred dividends are first taken out of the net income before calculating EPS.
Interpreting EPS
Earnings Per Share can be used to compare the earnings of two or more companies in a similar industry.
Just because one company makes more money than another, it does not mean that the shareholders are better off.
What matters is how much of the money the company makes actually trickles down to each shareholder and that depends on how many shares there actually are.
If two companies had the same number of shares outstanding, the higher EPS Company would have:
More lucrative earnings.
Higher percentage of earnings going to each share.
Potentially lower preferred dividends paid out.
Similarly, if two companies had the same net income, the higher EPS Company would have:
Fewer shares outstanding.
Shares that have a higher percentage of ownership in the company.
Shares that have a bigger claim to profits than the other company.
Hence, the higher the EPS between two companies in the same industry, the more money each share makes.
Example
Let’s say we wanted to evaluate two companies in the same industry like:
Honda (HMC:NYSE)
and Toyota (TM:NYSE)
Honda’s Net Income after Preferred Dividends: $6,000,000,000 ($6 Billion)
Honda’s Average Outstanding Shares: 1,500,000,000 (1.5 Billion shares)
Toyota’s Net Income after Preferred Dividends: $5,500,000,000 ($5.5 Billion)
Toyota’s Average Outstanding Shares: 1,000,000,000 (1 Billion shares)
At first look, it seems like Honda is the better company as it made more money (Net Income is higher).
But, as a shareholder, when you see how much of that money actually comes down to each share, your decision might change.
PE Ratio (Price-to-Earnings) is a valuation ratio that compares the price per share of a company’s stock to its earnings per share.
It basically shows how much investors are willing to pay for a share given the earnings currently generated.
It is also used to analyze whether a stock is overvalued or undervalued.
Formula
How to use the PE Ratio:
The PE Ratio by itself is just a number and not very useful.
When we compare PE ratios between companies and industries, we really start getting the picture for the particular company we are analyzing.
It does not make much sense to compare PE Ratios of companies across different industries, as each industry has its own unique way of conducting business.
It’s like comparing a doctor with an engineer to see which one is more valuable.
Hence, if comparing PE ratios, they should be compared between companies in the same or similar industries.
You can also compare the PE ratio of a company to the PE Ratio of the entire industry that it operates in to analyze whether the stock is over or under-valued.
How to interpret the PE Ratio
High P/E Ratio may mean:
Market sentiment: An overly optimistic PE Ratio can indicate the market expects big things from this company. The company has high growth possibilities.
Lifecycle: The company could be entering into the Growth or Shake-Out stage of its lifecycle.
Industry: A PE Ratio could be representative of the industry the company is. For example most technology companies have high PE Ratios.
Cover priced or over-bought: A high PE Ratio can indicate a given stock is priced to high and ready for a correction.
This means that it might be over-valued.
Be sure to compare against industry norms.
Low P/E Ratio may mean:
Lack of confidence: A low PE Ratio may indicate a lack of confidence in the future of the company.
Lifecycle: The company could be in the Mature or Decline stage of its lifecycle.
Industry: A PE Ratio could be representative of the industry the company is. For example most utility companies have low PE Ratios.
Sleeper: A low PE Ratio might be a sleeper just waiting to be discovered. This means that it might be undervalued, and a perfect time to start buying the shares.
Example
Coca-Cola and Pepsi operate in the same industry and produce goods that are very similar in nature.
Coca Cola’s (KO:NYSE) stock price (Price per Share): $66
Coca-Cola’s Earnings-per share (EPS): $5.26
Coca-Cola’s PE Ratio: $66 / $5.26 = 12.55
Pepsi’s (PEP:NYSE) stock price (Price per Share): $69
Pepsi’s Earnings-per share (EPS): $3.73
Pepsi’s PE Ratio: ($66 / $5.26) = 18.50
From our calculations, we can see that Pepsi has a higher PE Ratio than Coca-Cola.
This could be perceived a couple of different ways:
Coca-Cola is under-valued and should be bought.
Pepsi is over-valued and should be sold or shorted.
Investors do not perceive Coca-Cola as doing as well as Pepsi presently.
Pepsi is launching a new product that Coca-Cola is not.
The truth is normally some combination of these perceptions.
Over time, and with additional research, one can potentially pinpoint the exact occurrence and make a lot of money by trading according to his or her analysis.
*Important Note*:
The Earnings-Per-Share in the PE Ratio formula is a number that comes from the accounting books of the company.
Hence, it is possible to manipulate the EPS underlying the PE Ratio in order to trick investors into perceiving the stock differently.
It is important to independently verify that the company’s’ financial statements are sound and true.
Conclusion
A PE Ratio is an important valuation tool that can give key insights into whether a stock may be over or under-valued.
Fundamental analysis is the process of looking at the basic or fundamental financial level of a business, especially:
sales
earnings
growth
potential
assets
debt
management
products
competition
This type of analysis examines key ratios of a business to determine its financial health and gives you an idea of the value its stock.
Many investors use fundamental analysis alone or in combination with other tools to evaluate stocks for investment purposes. The goal is to determine the current worth and, more importantly, how the market values the stock.
The Top Down Approach to Fundamental Analysis
Usually fundamental analysis takes into consideration only those variables that are directly related to the company itself, rather than the overall state of the market or technical analysis data but here we are going to describe a top down approach to the typical fundamental evaluation: It starts with the overall economy and then works down from industry groups to specific companies.
As part of the analysis process, it is important to remember that all information is relative. Industry groups are compared against other industry groups and companies against other companies. It is important that companies are compared with others in the same group.
First and foremost in a top-down approach would be an overall evaluation of the general economy. When the economy expands, most industry groups and companies benefit and grow. When the economy declines, most sectors and companies usually suffer. Once a scenario for the overall economy has been developed, an investor can break down the economy into its various industry groups.
If the prognosis is for an expanding economy, then certain groups are likely to benefit more than others. An investor can narrow the field to those groups that are best suited to benefit from the current or future economic environment. If most companies are expected to benefit from an expansion, then risk in equities would be relatively low and an aggressive growth-oriented strategy might be advisable. A growth strategy might involve the purchase of technology, biotech, semiconductor and cyclical stocks. If the economy is forecast to contract, an investor may opt for a more conservative strategy and seek out stable income-oriented companies. A defensive strategy might involve the purchase of consumer staples, utilities and energy-related stocks.
To assess a industry group’s potential, an investor would want to consider the overall growth rate, market size, and importance to the economy. While the individual company is still important, its industry group is likely to exert just as much, or more, influence on the stock price. When stocks move, they usually move as groups
Once the industry group is chosen, an investor would need to narrow the list of companies before proceeding to a more detailed analysis. Investors are usually interested in finding the leaders and the innovators within a group. The first task is to identify the current business and competitive environment within a group as well as the future trends. How do the companies rank according to market share, product position and competitive advantage? Who is the current leader and how will changes within the sector affect the current balance of power? What are the barriers to entry? Success depends on an edge, be it marketing, technology, market share or innovation. A comparative analysis of the competition within a sector will help identify those companies with an edge, and those most likely to keep it.
At this point you will have a shortlist of companies and the final step to this analysis process would be to take apart the financial statements and come up with a means of valuation. Some of the more popular ratios are found by dividing the stock price by a key value driver.
Fundamental Analysis Tools
These are the most popular tools of fundamental analysis. They focus on earnings, growth, and value in the market. For convenience, we have broken them into separate articles.
None of these mean much on their own but when you combine some of them together and adapt your combinations based on the sector the company you’re analyzing is in you will find that they are very good identifying the true value of a stock, thus find you identify the “ticket price” of your potential investment and to determine if your current investments are at or near their full potential…
How to use multiples and ratios to value a company
This methodology assumes that a company will sell at a specific multiple of its earnings, revenues or growth. An investor may rank companies based on these valuation ratios. Those at the high end may be considered overvalued, while those at the low end may constitute relatively good value. But it could also mean that the ones on the low end are “bad companies” and are not worth investing in while the ones on the high end could be very good companies which still have room to grow… Remember that the market is usually right in the long run…
Keep Technical Analysis in mind as well
After all this work you will be left with a handful of candidates and this is where I recommend using technical analysis to develop a trading plan for each one of them. I know investors tend to shy away from technical analysis but this a grave mistake, in my opinion. Knowing how to read charts and understanding that technical analysis is in fact understanding basic human psychology will help you maximize your gains and minimize your losses; how does that sound to you?
Advantages of Fundamental Analysis
Fundamental analysis is good for long-term investments based on long-term trends, very long-term. The ability to identify and predict long-term economic, demographic, technological or consumer trends can benefit patient investors who pick the right industry groups or companies.
Sound fundamental analysis will help identify companies that represent a good value. Some of the most legendary investors think long-term and value. Graham and Dodd, Warren Buffett and John Neff are seen as the champions of value investing. Fundamental analysis can help uncover companies with valuable assets, a strong balance sheet, stable earnings, and staying power.
One of the most obvious, but less tangible, rewards of fundamental analysis is the development of a thorough understanding of the business. After such painstaking research and analysis, an investor will be familiar with the key revenue and profit drivers behind a company. Earnings and earnings expectations can be potent drivers of equity prices. Even some technicians will agree to that. A good understanding can help investors avoid companies that are prone to shortfalls and identify those that continue to deliver. In addition to understanding the business, fundamental analysis allows investors to develop an understanding of the key value drivers and companies within an industry. A stock’s price is heavily influenced by its industry group. By studying these groups, investors can better position themselves to identify opportunities that are high-risk (tech), low- risk (utilities), growth oriented (computer), value driven (oil), non-cyclical (consumer staples), cyclical (transportation) or income-oriented (high yield).
Stocks move as a group. By understanding a company’s business, investors can better position themselves to categorize stocks within their relevant industry group. Business can change rapidly and with it the revenue mix of a company. This happened to many of the pure Internet retailers, which were not really Internet companies, but plain retailers. Knowing a company’s business and being able to place it in a group can make a huge difference in relative valuations.
Disadvantages of Fundamental Analsyis
The main disadvantage for me is that if used on its own, fundamental analysis (FA)doesn’t take into consideration the “herd mentality” phenomenon. In the long run, the price per share (PPS) of companies is driven by their earnings, i.e. the profit they’re yielding. In the short term, the momentum can be quite influential on the PPS: I’m sure you’ve noticed that some stock are considered market darlings and, to a certain degree, it doesn’t matter what their quarterly results are; people keep on buying. The same applies for companies that, all of a sudden, fall out of favor for whatever reason, genuine or not. They keep getting hammered regardless of the results the company pumps out, until one day it reverses… FA doesn’t consider this irrational behavior.
Fundamental analysis may offer excellent insights, but it can be extraordinarily time-consuming. Time-consuming models often produce valuations that are contradictory to the current price prevailing onWall Street. When this happens, the analyst basically claims that the whole street has got it wrong. This is not to say that there are not misunderstood companies out there, but it is quite brash to imply that the market price, and hence Wall Street, is wrong.
Valuation techniques vary depending on the industry group and specifics of each company. For this reason, a different technique and model is required for different industries and different companies. This can get quite time-consuming, which can limit the amount of research that can be performed.
Fair value is based on assumptions. Any changes to growth or multiplier assumptions can greatly alter the ultimate valuation. Fundamental analysts are generally aware of this and use sensitivity analysis to present a base-case valuation, a best-case valuation and a worst-case valuation. However, even on a worst-case valuation, most models are almost always bullish, the only question is how much so.
The majority of the information that goes into the analysis comes from the company itself. Companies employ investor relations managers specifically to handle the analyst community and release information. As Mark Twain said, “there are lies, damn lies, and statistics.” When it comes to massaging the data or spinning the announcement, CFOs and investor relations managers are professionals. Only buy-side analysts tend to venture past the company statistics. Buy-side analysts work for mutual funds and money managers. They read the reports written by the sell-side analysts who work for the big brokers (CIBC, Merrill Lynch, Robertson Stephens, CS First Boston, Paine Weber, DLJ to name a few). These brokers are also involved in underwriting and investment banking for the companies. Even though there are restrictions in place to prevent a conflict of interest, brokers have an ongoing relationship with the company under analysis. When reading these reports, it is important to take into consideration any biases a sell-side analyst may have. The buy-side analyst, on the other hand, is analyzing the company purely from an investment standpoint for a portfolio manager. If there is a relationship with the company, it is usually on different terms. In some cases this may be as a large shareholder.
When market valuations extend beyond historical norms, there is pressure to adjust growth and multiplier assumptions to compensate. If Wall Street values a stock at 50 times earnings and the current assumption is 30 times, the analyst would be pressured to revise this assumption higher. There is an old Wall Street adage: the value of any asset (stock) is only what someone is willing to pay for it (current price). Just as stock prices fluctuate, so too do growth and multiplier assumptions. Are we to believe Wall Street and the stock price or the analyst and market assumptions? It used to be that free cash flow or earnings were used with a multiplier to arrive at a fair value. In 1999, the S&P 500 typically sold for 28 times free cash flow. However, because so many companies were and are losing money, it has become popular to value a business as a multiple of its revenues. This would seem to be OK, except that the multiple was higher than the PE of many stocks! Some companies were considered bargains at 30 times revenues.
What have we learnt?
To conclude, fundamental analysis can be valuable, but it should be approached with caution. If you are reading research written by a sell-side analyst, it is important to be familiar with the analyst behind the report. We all have personal biases, and every analyst has some sort of bias. There is nothing wrong with this, and the research can still be of great value. Learn what the ratings mean and the track record of an analyst before jumping off the deep end. Corporate statements and press releases offer good information, but they should be read with a healthy degree of skepticism to separate the facts from the spin. Press releases don’t happen by accident; they are an important PR tool for companies. Investors should become skilled readers to weed out the important information and ignore the hype.
Class B Shares are a form of common stock that may have more or less voting rights that Class A shares. Generally Class B shares have lesser voting rights, but be vary of some companies that trick investors by using the perception of Class “B” (compared to “A”) shares to attach more voting rights to them than Class A shares.