A call optionThe right, but not the obligation, to buy a stock at a certain price before the expiration date. is the option (remember, not an obligation) to buy 100 shares of a stock for an agreed price (the strike price The price at which the option contract can be executed.) by an agreed date in the future ( expiration date The date that the option expires, usually the 3rd Friday of the month in the U.S. ).
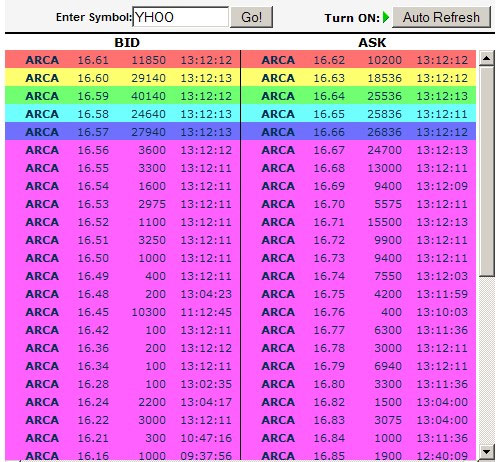
Here’s how it works: you buy one call option contract which expires in October for 100 shares in Yahoo! (YHOO) stock. For now, let’s assume that this call option was priced at $1.00, or $100 per contract. It now gives you the right, but not the obligation, to buy 100 shares of YHOO at $30 per share anytime between now and the 3rd Friday in October.

In the U.S., most equity and index option contracts expire on the 3rd Friday of the month. Also note that in the U.S. most contracts allow you to exercise your option at any time prior to the expiration date. In contrast, most European options only allow you to exercise the option on the expiration date!
If the price of YHOO rises above $30 by the expiration date in October, to say $35, then your options are “in-the-money” by $5 and you can exercise your option and buy 100 shares of YHOO at $30 and immediately sell them at the market price of $35 for a tidy $5 per share profit. Of course, you don’t have to sell it immediately—if you want to own the 100 YHOO shares, then you don’t have to sell them. Since all option contracts cover 100 shares, your real profit on that one option contract is actually $400 ($5 x 100 shares – $100 cost). Not too shabby, eh?
On the other hand, if the market price of YHOO is $25 in October, then you have no reason to exercise your option and buy 100 shares at $30 share for an immediate $5 loss per share. That’s where your option comes in handy since you do not have the obligation to buy these shares at that price – you simply do nothing, and let the option expire worthless. When this happens, your options are considered “out of the money” and you have lost the $100 that you paid for your call option.
Call options that are set to expire in 1 year or more in the future are called LEAPs and can be a more cost effective way to investing in your favorite stocks.
Always remember that in order for you to buy this YHOO October 30 call option, there has to be someone that is willing to sell you that call option. People buy stocks and call options believing their market price will increase, while sellers believe (just as strongly) that the price will decline. One of you will be right and the other will be wrong. You can be either a buyer or seller of call options.
The seller has received a “premium” in the form of the initial option cost the buyer paid ($1 per share or $100 per contract in our example), earning some compensation for selling you the right to “call” the stock away from him if the stock price closes above the strike price. We will return to this topic in a bit.
Understanding Call Options
 Generally speaking, options are used in many areas of business and investment. Employees of larger companies frequently get stock options as an incentive to stay with the company for a long time and help the company increase in value. A lot of real estate transactions involve the option to purchase additional neighboring acreage at a certain price within a certain number of years. And even leasing a car usually contains a “purchase option” at the end of the lease term.
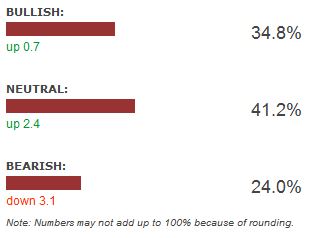 As a newer investor, if you can get a sense of the investment community towards your stocks, you will have good information to make better trades. Even if investor sentiment is bearish (predicting a down market), you can adjust your strategy to make profitable trades in the short-term.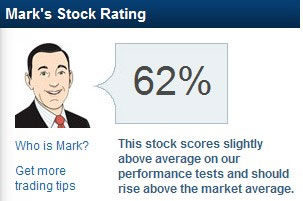

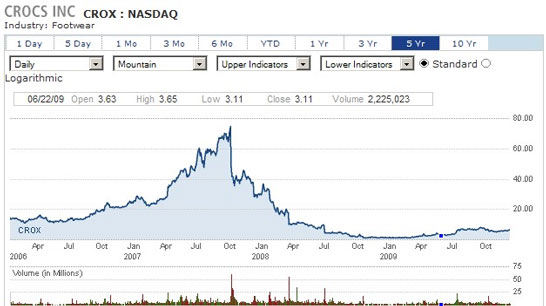
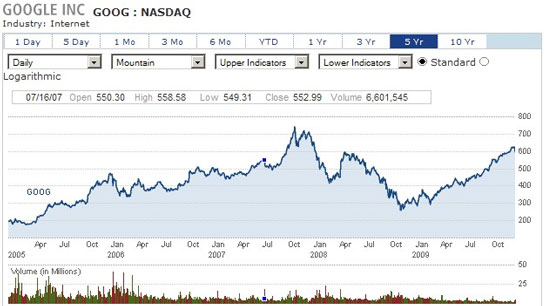
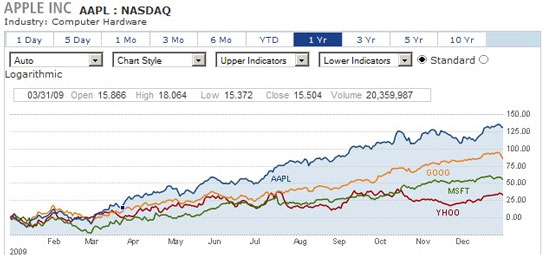

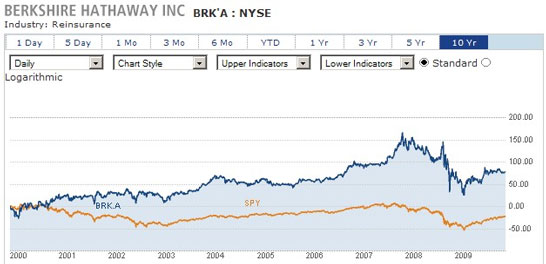

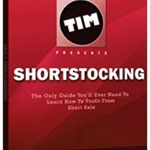 One investor who has literally made millions in busting penny stock “pump and dump” schemes is Timothy Sykes. As a teenager, he turned $10,000 into his first $1,000,000 by spotting and then shorting these pump and dump schemes.

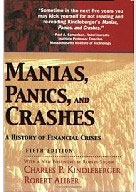
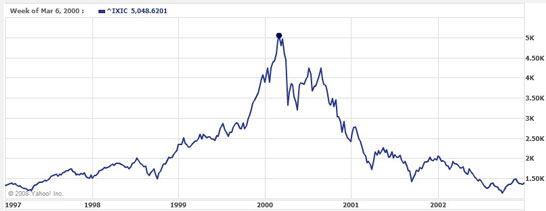
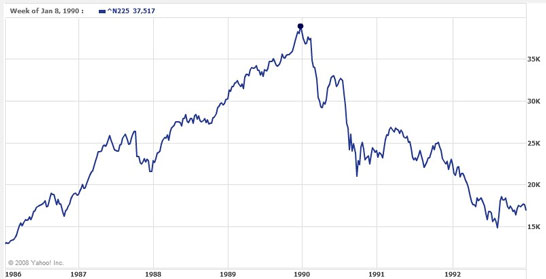
 Another way to know if there is an investing mania is to be aware of what is popular, and what is really just way too popular. Remember, prices are nothing more than a reflection of supply and demand, and if everyone wants something, then its price will skyrocket! But as soon as buyers move on to something else, those prices must plummet! Are the news magazines all writing about an investment? Are they on the covers with splashy headlines and creating a feeding frenzy among the masses? If so, then beware…
 In the 1980s, John Bollinger developed a new technical analysis tool to measure the highs and lows of a security price relative to previous trade data. These “trading bands” help investors track and analyze the “bandwidth” of stock prices over a period.

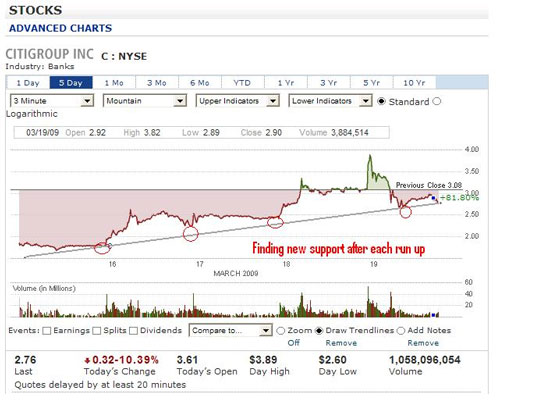


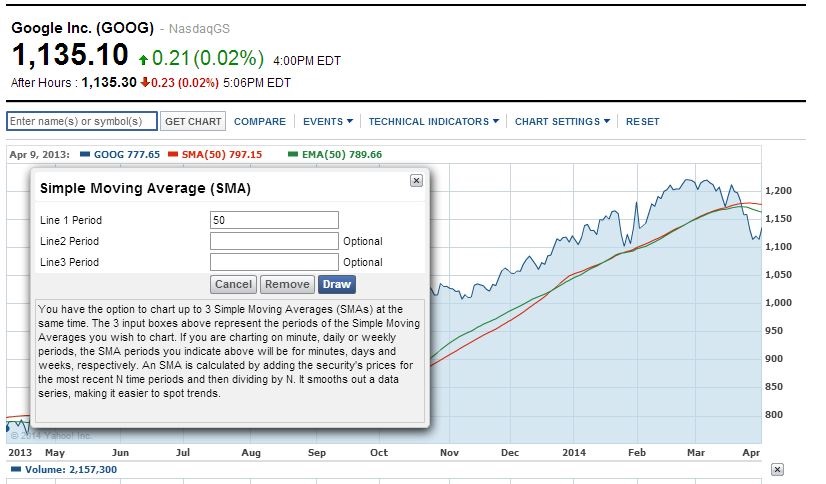

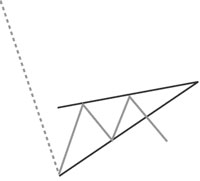
 Since the data creating the design is typically slanted against the current trend, a descending flag is considered a “bullish” indicator, while a wedge is viewed as a “bearish” predictor. A typical wedge or flag lasts longer than one month but less than three months. Longer trends will often create designs other than a wedge or a flag.
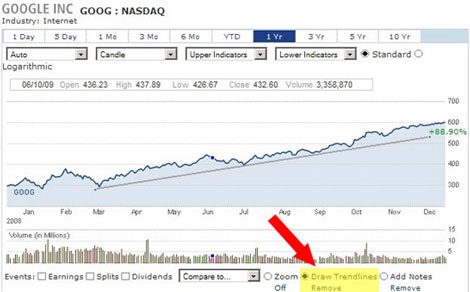
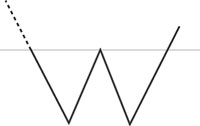
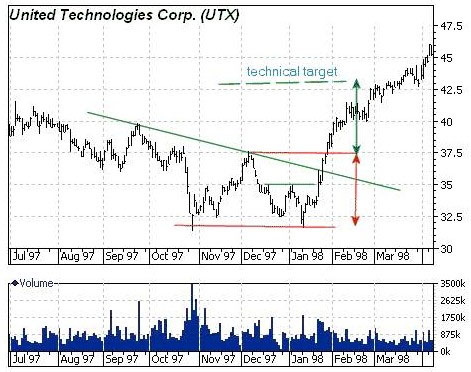
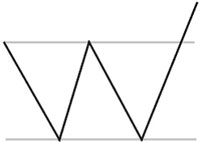

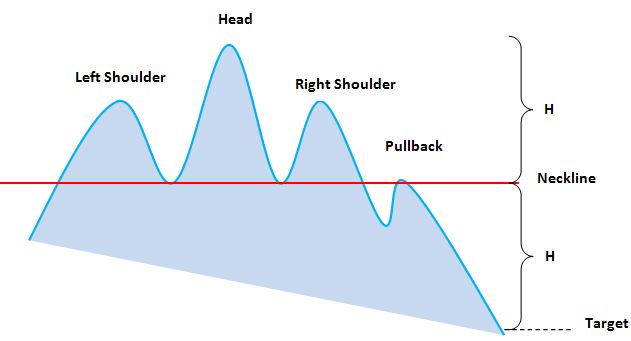
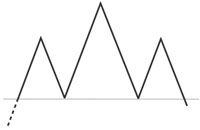 Don’t you love the terminology that pictorially associates these charts with their graphic representations? The Head and Shoulders is an extremely popular pattern among investors because it’s one of the most reliable of all chart formations. It also appears to be an easy one to spot. Novice investors often make the mistake of seeing Head and Shoulders everywhere. Seasoned technical analysts will tell you that it is tough to spot the real occurrences.
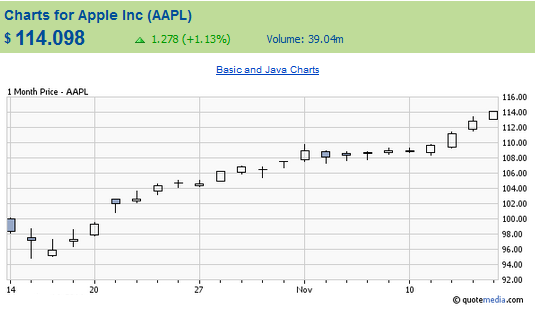


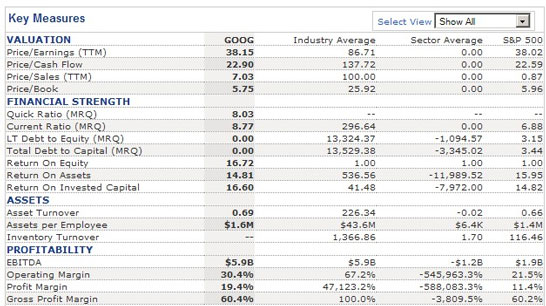
 A company with well-respected and reliable products that have been accepted by the consumer market is often a valuable investment. How many rolls of Charmin toilet paper have you purchased in your lifetime? How many tubes of Colgate toothpaste? How many boxes of Tide laundry detergent? How many gallons of BP gas have you pumped into your car? How many McDonald’s fries have you eaten? These are all strong, stable brands.

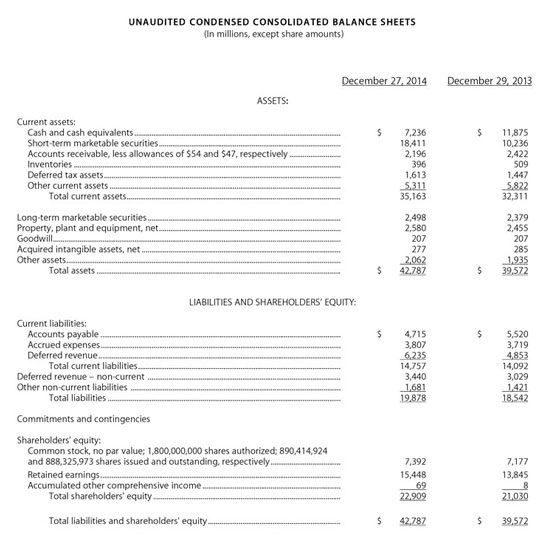
 Once you have understood a company’s profitability, take a look at the Statement of Cash Flows because this is the second most important element of Fundamental Analysis and it frequently needs more than a cursory examination. Many experts strongly contend that good cash flow is more important than earnings to ensure company viability for the long-term. Surprised? Don’t be.
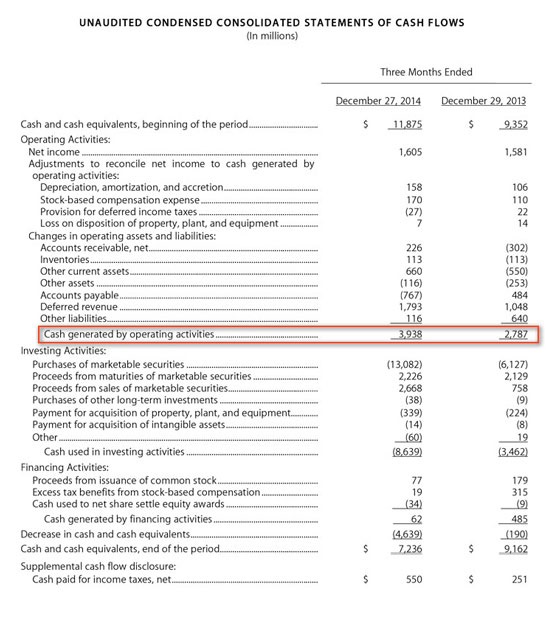
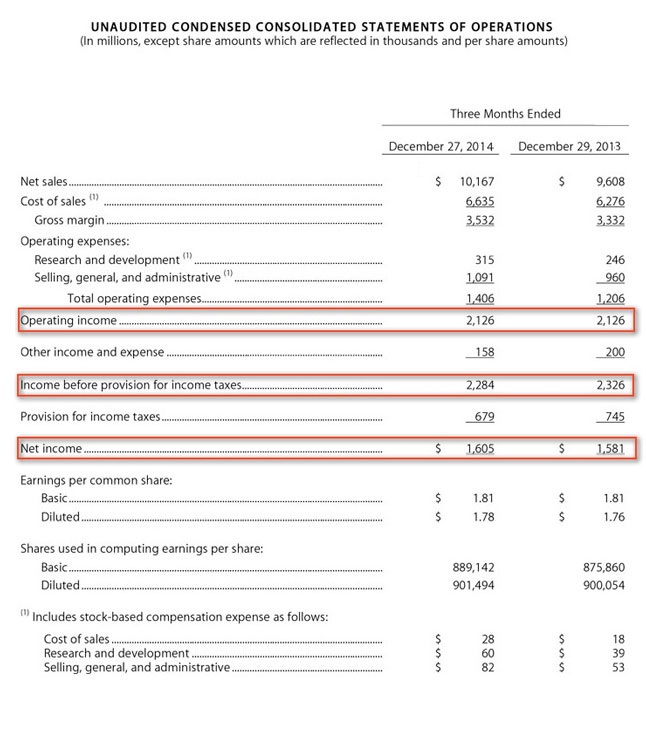
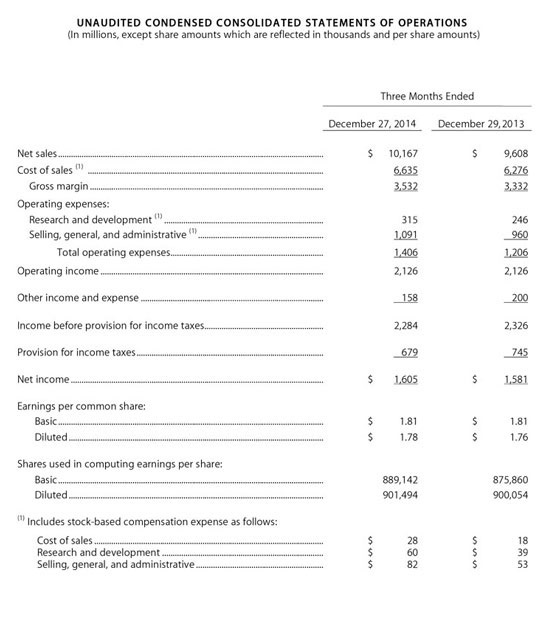
 The first place to start analyzing a company is to go straight to the source and review the financial information that the company is publishing about itself.