Fractions
What is a fraction?
A “Fraction” means one piece of a whole. You can use fractions in any case where it might be useful to look at something in parts, rather than the whole thing at once.
The most delicious fractions are slices of pizza. If the pizza is in 8 slices, we know that there are 8 parts. This means any time we’re talking about its parts, we know it is “__ out of 8”, or “__ / 8”. For the whole pizza, we have all 8 slices.


Now let’s eat a slice! That will remove 1 of our slices and leave us with 7 and we had 8 slices originally. Or as a fraction:


The bottom number in the fraction is the whole and the top number in the fraction is how much we have currently (in this case, seven slices of pizza).
Example Using Your Portfolio
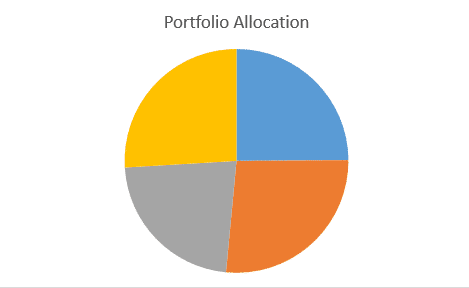
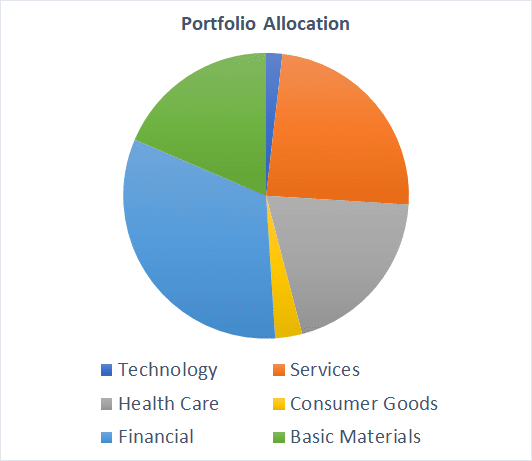
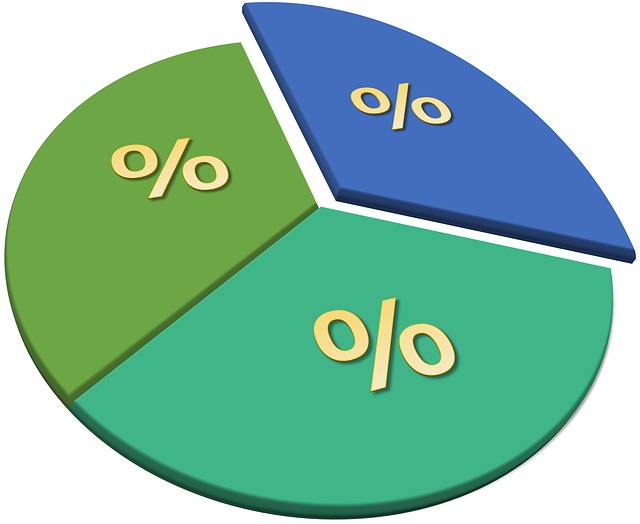
If you look at your pie chart, you can also see examples of fractions with your pie chart:
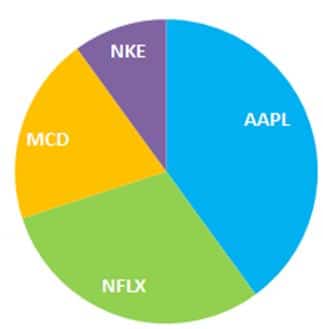
In this case we can’t divide the pie into equal pieces like we did with the pizza, since some stocks have a lot more than others. However, we can still show what “Fraction” of our portfolio is taken up by each stock.
In this example, lets say our portfolio has NKE(Nike), MCD (Mcdonald’s), NFLX (Netflix), AAPL (Apple).
Even though each stock is taking up different amounts of the whole, if we divide our portfolio in to equal parts, we can still get the fraction taken up by each stock.

Now if you want to know how much of each stock we have as a fraction. We count how many wedges (or slices) we have total: 10
Then we count how many of each stock we have (count the same colors)
Just like before, the bottom number in the fraction is called the “Denominator” and is how many parts are in the whole.
The top number in the fraction is called the “Numerator” is how many parts we have:

If we added all of of these fractions together we would get 10 / 10 which is equal to 1 (meaning the whole).
Comparing Fractions
You can only compare two fractions that have the same “Denominator“. For example, we know that 3/10 is bigger than 2/10, but you cannot directly compare it to 2/3. When you see the “/” sign, or whatever separates the numerator and the denominator, it means “Out Of” (so “1/10” means “1 out of 10”)
If you do want to compare two fractions, one way is to multiply them so their denominators are the same. In this example, we can convert our fractions to both be showing their value out of 30 parts instead of 10 or 3.
To do this, multiply both the numerator and denominator of each fraction until the denominator is the “Common” number.

As long as you multiply the numerator and denominator by the same number, the fraction’s value will stay the same (“2 out of 3” is the same as “20 out of 30”). Now both of our denominators are 30, so we can compare them directly!
When You Cannot Use Fractions
Fractions are only used to look at parts of one thing, they are not used to compare different things. For example, we can use a fraction to show how much of our portfolio is made up of one stock, but we cannot use a portfolio to compare a company’s stock price to how much money it makes.
Percentages
Fractions work well when what we are looking at is always different parts of the same whole, but when we want to compare parts of different things, we need to use percentages. A percentage is a calculation that will tell you how big one thing is in relation to another thing. For example, you can use a percentage to tell how big your current portfolio value is compared to how much you started with.
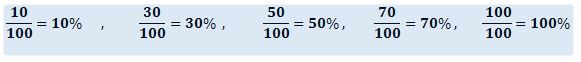
Percentages work like fractions, but the denominator is always 100, so you can always know which percentage is bigger or smaller. You can convert any fraction in to a percentage to compare them. This means when you see a percentage, the “%” sign means “Out of 100“.
Calculating Your Portfolio Return
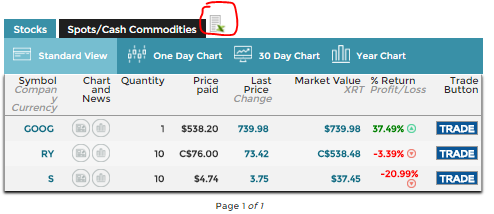
In the rankings page you will be able to see Gain / Loss (%). We call this your Portfolio Return.

This is calculated by looking at the current value of your portfolio and compare it to your starting value and multiplying by 100.
Or ((Current Value / Starting Value) – 1) * 100 . You have to do it in this order: (Current Value / Starting Value) then subtract 1 and then multiply by 100.
- Divide Current Value / Starting Value. This scales down both numbers so that “Starting Value” = 1. If your Current Value > Starting Value, the number you’ll get will be bigger than 1. If your Current Value < Starting Value, this number will be less than 1.
- Subtract 1 from the result. This means makes the “comparison number” 0 instead of 1.
- Multiply the result by 100. This makes your comparison 100 instead of 0.
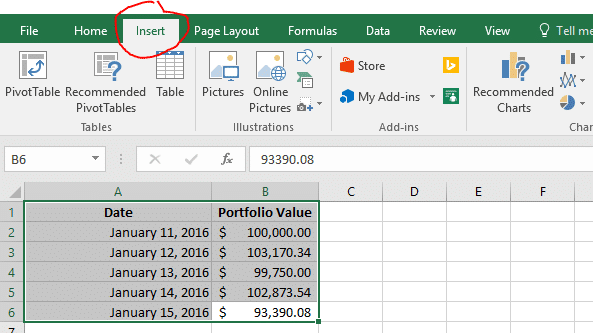
For education1 on the rankings page above, you can calculate the Portfolio Return with the same steps:
- 103,985.43 / 100,000 = 1.0398543
- 1.0398543 – 1 = 0.0398543
- 0.0398543 X 100 = 3.98543% (we around the percentage to 2 decimal places, so it appears as 3.99%).
Calculating Stock Return
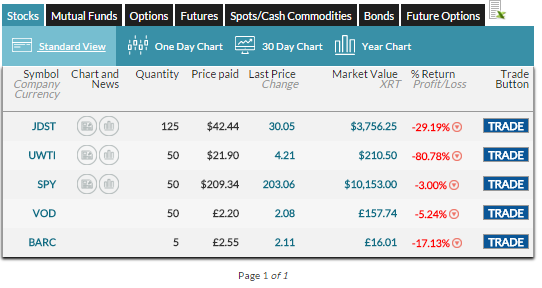
Percent Return is very useful for comparing different stocks too.

The NFLX stock (1.54%) has a higher percentage return than the AAPL stock (1.24%) even though the number of AAPL (11.85) is higher than (8.05).
$11.85 is the amount of dollars you gained. The 1.24% is how much the stock price went up by. The percentage (bottom number) is much more important than the amount of dollars (top number), because it tells you how much the value changed compared to the price you bought it at.
This is because of the number of shares and the price. To calculate the percentage, compare the last price and divide it by the price paid or
((Last Price / Price Paid) – 1) * 100 :
AAPL : ((96.70 / 95.52) -1) *100 = 1.24%
NFLX: ((106.06.70 / 104.45) -1) *100 = 1.54%
Relationship Between Percentages And Fractions
Lets go back to the pie charts we were using for fractions. Every fraction can be written as a percentage, with the “Whole” equalling 1
We bought 10 shares of AAPL (Apple), 5 shares of NKE (Nike) and 5 shares of NFLX (Netflix).

The numbers show the percentage of each stock’s value over your total value of your portfolio. Written as a fraction, it would be
Value of this stock in your portfolio / Total Value Of All Your Stocks
Going back to the portfolio example, we can calculate the percentage of each stock by comparing their Market Value with the total value of all of our stocks
To get these numbers we first grab the market value for each stock and add them together, so in our example:

292.75 (NKE) + 958.20 (AAPL) + 532.00 (NFLX) = 1782.95 = Total Value
Then if we want the percentage like in the pie chart for NKE, we compare the value of NKE to the Total Value:
NKE: ((292.75 / 1782.95) – 1 * 100 = 16.4 %
AAPL: ((958.20 / 1782.95) – 1 * 100 = 53.7 %
NFLX: ((532 / 1782.95) – 1 * 100 = 29.8 %
Both the fractions and the percentages will always equal 100 / 100 or 100% because our pie is whole.
By summing up 16.4 % + 53 .7 % + 29.8 % = 100 %
When To Use Percentages
Percentages are used normally to calculate the growth in something over time (like your portfolio return), or to compare parts of a whole when the denominators would be bigger than 10 (in our fraction conversion example, we can also say 2/3 = 66.6% and 2/10 = 20%).
Ratios
Ratios are a lot like fractions, but the biggest difference is that we only use ratios to compare different things. For example, if we want to compare the price of a company’s stock with how much money that company makes per share, we would use what is called the “Price – Earnings Ratio”. Since the “price of a stock” is not a part of “how much the company makes per share”, we would not be able to use a fraction. We would want to know the P/E ratio because that tells us how much the company is actually making compared to how much we’re paying for a share of it.
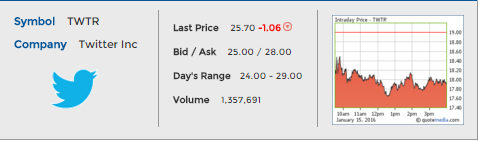
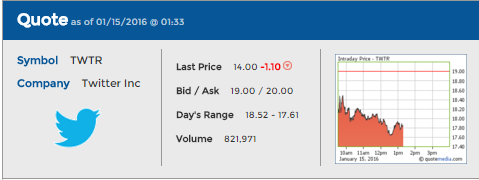
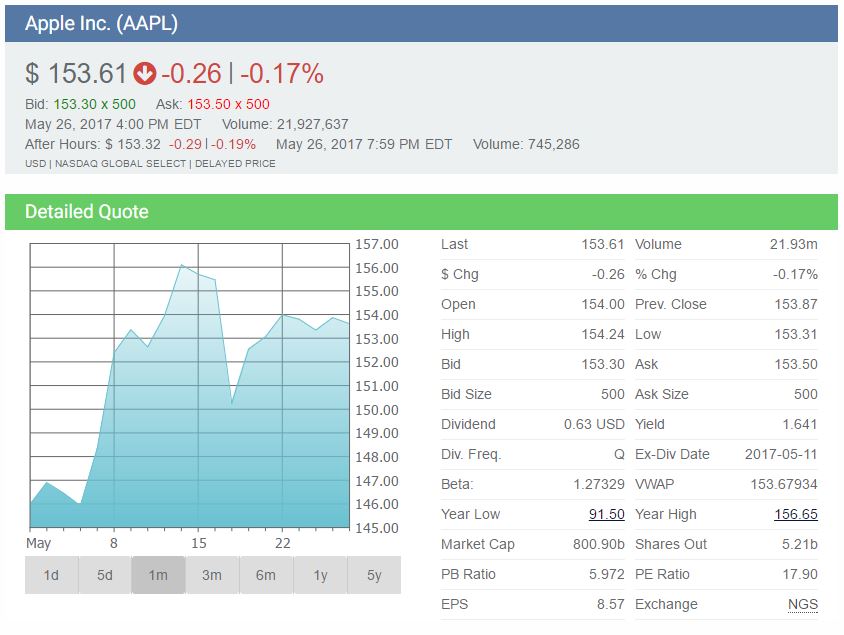
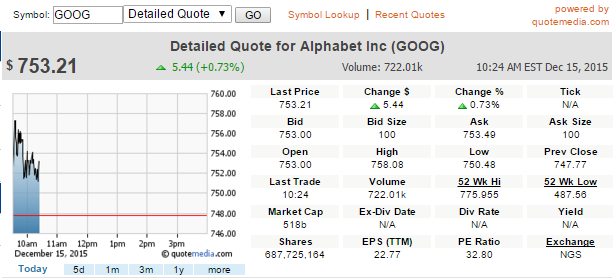
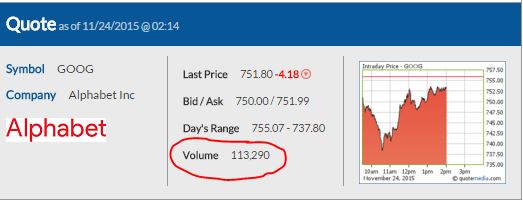
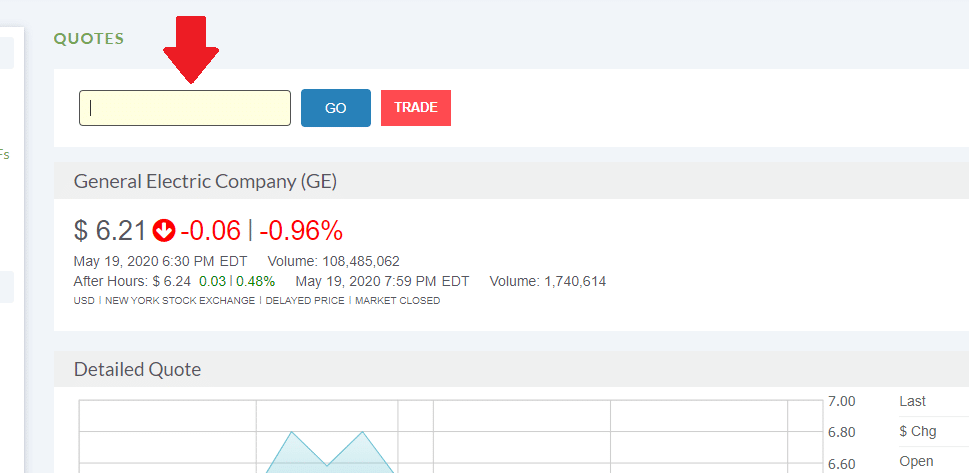
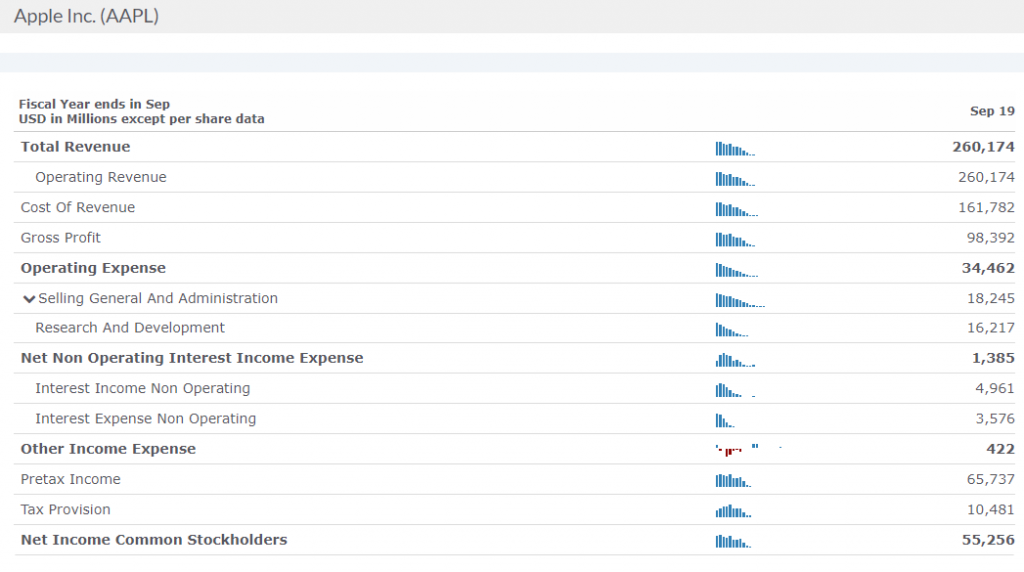
We can actually get all of this information on the Quotes page and find the P/E Ratio ourselves. EPS is the “Earnings per Share”. With Apple (AAPL) as the example:

The stock price is $100.15, while the Earnings-per-Share (EPS) for the last 12 months is $9.21. We can wright the ratio as
$100.15 : $9.21
When we read ratios, the “:” symbol means “to”, so we would say “100.15 to 9.21”.
Calculating this value is also easier than calculating a percentage. Simply divide the number on the left by the number on the right:
100.15 / 9.21 = 10.5 = PE Ratio
The P/E ratio gives an idea of how much investors are valuing the company’s current income – high P/E ratios mean investors expect the revenue to grow a lot in the future, low P/E ratios mean investors think the company will grow more slowly. By calculating the P/E ratio for different companies, you can compare the investor attitudes easily.
Pop Quiz
[qsm quiz=53]