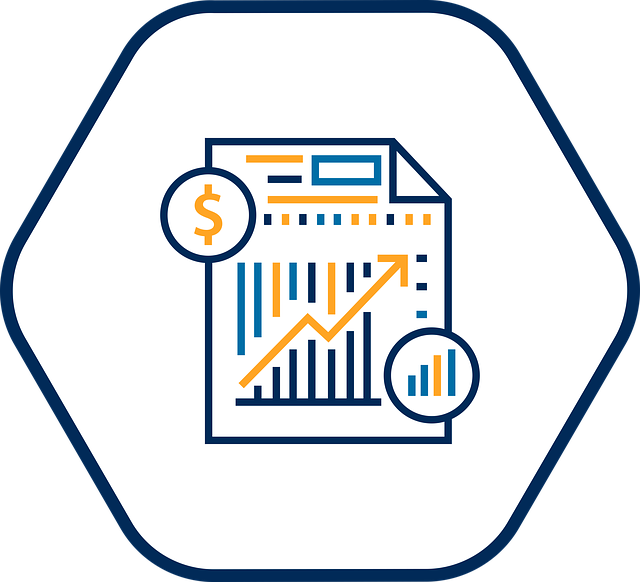
A company’s financial statements give investors, managers, and other “users” a complete, honest look at its financial health. Finished financial statements follow a standardized format, letting investors compare different companies in the same industry apples-to-apples.
For the company’s financial reporting team, this presents a challenge – every business’s internal operations are different, but all activities need to be summarized into a standardized format. Businesses assign teams to create their financial statements to meet this challenge – the Income Statement, Balance Sheet, Cash Flow Statement, and other smaller reports issued by every publicly-traded company.
Financial statements follow a logical sequence – each statement needs to be completed and used as an input to the next.
Worksheets
Financial statements are summaries of activities, so the first step in creating any financial statement is to start by building worksheets. Worksheets are updated almost daily with raw data – all sales, expenses, depreciation, and any other flow of money into, out of, or within a company.
Worksheets are the first step in translating the unique way each business operates into easily-understandable, standardized financial statements. This means each company’s worksheets for each type of financial statement is unique – their accounting and financial analysis teams work together to build worksheets that help distill business operations into raw financial data.
Building Worksheets
Worksheets start with the general ledgers of a business, and sort the data into the categories they need to build the standardized financial statements. This is usually a set of spreadsheets – a separate set of worksheets used to build each type of financial statement.
Building worksheets is time-consuming. Some smaller businesses with an owner-operator trying to build their own financial statements may try to skip building worksheets, and instead convert their raw ledger data directly into finished financial statements. This can save some time if they only want to produce financial statements very rarely (like when applying for new bank loans), but lends itself to errors and headaches for companies with normal reporting schedules.
Building new worksheets takes care – any change to worksheets needs to be verified that it will be consistent with previous financial statements, and conforms to GAAP.
Income Statement

Income statements try to answer one simple question: how much money did this business make or lose? This means income statements look at all transactions over a given period of time, usually a quarter or year. The final product of the financial statement is to be able to produce the following equation:
Net income = Revenues – Expenses
It is in this document that revenues are matched with expenses to determine whether a company has net income (revenues are more than expenses) or a net loss (expenses are more than revenues). The worksheet can be a helpful tool in starting and completing an income statement. The format of an income statement can change depending on the type of business.
The basic format is to have the revenues mentioned first and the expenses afterward. The revenue accounts are sales, fees earned, rent revenue, dividends revenue, and any other revenue that all depends on the type of business. The operating expenses are either selling or administrative, but expense can vary depending on the type of business. However, in general, expenses come from advertising, delivery, depreciation of the building, depreciation of equipment, salaries, and wages, and many other things that a business needs to incur to keep the company up and to run.
Revenues
Each company is different, but to simplify let’s say that Apple splits their revenue up into Sales revenue, Interest revenue, and gains on sales of assets. Their revenue would look something like this.
- Revenues
- Sales Revenue – $1,500,000
- Interest Revenue – $250,000
- Gains on Sales of Assets – $100,000
- Total Revenue – $1,850,000
Expenses
Expenses work in a similar format but are obviously categorized as money going out of the company. Apple, if simplified again would have their expenses split into Cost of goods sold, interest expense, commission’s expense, and loss from a lawsuit. Their expenses would look something like this.
- Expenses
- Cost of goods sold – $950,000
- Interest expense – $50,000
- Commissions expense – $75,000
- Loss from lawsuit – $250,000
- Total expenses – $1,325,000
Once this is all tied together at the end the final number is the net income and is calculated by subtracting total expenses from total revenue. This would look like this.
Net Income = $1,850,000 – $1,325,000 = $525,000
Retained Earnings
Retained earnings are a portion of accumulated net income that gets repurposed into other assets and liabilities for the benefit of the firm. At the discretion of the company, retained earnings can also be distributed to stockholder’s as dividends.
Retained earnings are calculated by taking the beginning balance of retained earnings and adding any net income (subtracting net loss) and deducting dividends to get the ending balance of retained earnings for the year-end.
Ending Balance of Retained Earnings = Beginning Balance + Net income (- Net loss) – Dividends
The retained earnings statement is not a mandatory financial statement to have. A company can furnish it to give internal users a better idea if securities should be issued, repurchased, send out dividends, fund new projects, or take in more debt. Its purpose is to help a firm make better investment choices than the previous period.
Shareholder’s Equity
The statement of shareholder’s equity is a stripped-down version of the Retained Earnings statement, with more emphasis on the actual stock of the company. This one is mandatory, and will later be used when building the Balance Sheet.
The statement of stockholder’s equity reports on changes in the stockholder equity accounts such as preferred stock, common stock, additional paid-in capital, retained earnings, and treasury stock. Other accounts such as accumulated other comprehensive income (loss) and noncontrolling interest are included in the statement of stockholder’s equity.
This statement is important because it reveals the contributions and distributions of a company about the accounts just mentioned and the adjustments processed in the period that they cover. In other words, it gives investors a clear picture about what is happening with their stock (diluted with more shares, if the company is buying back shares as treasury stock, ect).

Balance Sheet
The Balance Sheet is the biggest of the main financial statements, and the last to be prepared. The balance sheet will “balance” all of the assets, liabilities, and shareholder’s equity at a specific period of time. While the Income Statement will look at the flow of money over a period (month, quarter, or year), the Balance Sheet is a snapshot – showing its balance at a precise moment in time.
The goal of the Balance Sheet is to give users a picture at a company’s solvency and flexibility. How well are they able to make payments on debt? How liquid are their assets, and how financially flexible are they to whether any unexpected market shocks? This is done by first breaking down, then summing up, the different categories of assets and liabilities, and showing how this compares with shareholder’s equity and retained earnings.
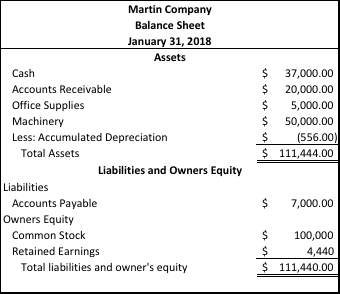
The asset accounts include current assets (cash, accounts receivable, supplies, prepaid expenses, etc.), long-term investments (equity investments), property-plant-and-equipment (land, building, etc.), and intangible assets (goodwill, trademarks, etc.). The liabilities accounts include current liabilities (liabilities within one year or less – notes payable, accounts payable, income taxes payable, salaries payable, etc.) and long-term debt (debt that is more than one year). The stockholder’s equity accounts can come from contributed capital from the issuance of stock, additional paid-in capital, retained earnings, accumulated other comprehensive income, treasury stock, and various equity accounts, which depends on the type of business.
Comparing balance sheets over time will usually give a very clear picture of a company’s financial health.
Cash Flow Statement
The Cash Flow statement can be produced at any point between any of the other statements. Cash does not necessarily mean income, so the purpose of the Cash Flow statement is not to show profits or loss – the Cash Flow Statement bridges the gap of information from the Income Statement and the Balance Sheet.
Like the Income Statement, the Cash Flow Statement shows the flow of money into, out of, and within a business over a period of time. Unlike the income statement, it is not concerned with “net income” or “net loss” – rather, it tries to help paint a picture of liquidity, like the Balance Sheet. The Cash Flow statement needs to answer exactly how the “Cash” line of the balance sheet is calculated.
It is here that the total amount of cash reported on the balance sheet (the ending balance) is explained based on the cash out-flows that are deducted from the cash in-flows. To prepare the statement of cash flows a company looks at prior periods balance sheets to make a comparative analysis (to see what increased or decreased), the current periods income statement to help calculate the net cash provided from operating activities, and any data from transactions that have occurred.
Cash Flow Calculation Steps
Cash flows from operating activities – This should be the bulk of cash flow in most businesses, calculating the cash flow from normal business activities, including amortization and depreciation.
Add Net income + Depreciation expense + Amortization + Loss on sale of plant assets ( – Gain on sale of plant assets) + Decrease in accounts receivables ( – Increase in accounts receivables) + Decrease in inventory ( – Increase in inventory) + Increase in accounts payable ( – Decrease in accounts payable) = Net cash provided (used) by operating activities
Cash flows from investing activities – If a company has investments outside its normal operations, this cash also needs to be accounted for. This often comes from selling assets for most businesses.
Add Sale of plant assets (Subtract purchase of plant assets) + Sale of equipment ( – Purchase of equipment) + Sale of land ( – Purchase of land) = Net cash provided (used) by investing activities
Cash flows from financing activities – This relates to Shareholder’s Equity – how is invested money being used, and the movement of cash into and out of stock.
Add issuance of stocks – Dividend payments – Redemptions and repurchases = Net cash provided (used) by financing activities
Once the amounts of each category are determined, they are combined by taking the sum or difference of the total amounts to get the net increase in cash (more cash coming in than coming out) or net decrease in cash (more cash being spent than being earned).
Net increase (decrease) in cash + Cash at the beginning of the year = Cash at the end of the year (the total cash you see on the balance sheet)
Consolidated Financial Statements and Annual Reports
Every company reports their financials every year on a different date depending on their fiscal year. Some do it in the winter, while others choose the summer. This report is an all-inclusive finding on what the company has been doing for the previous year – wrapping all of these financial statements into one big bundle for publication called the 10k.
The report starts with a description of the company and what they do. From there they describe any new changes during the year such as mergers or acquisitions. After a few pages of qualitative descriptions of their year, the reader runs into their financial statements. This is a great way to read over their income statement, balance sheet, statement of stockholders equity etc. and really understand how they have been doing over the past year and if they’re improving or declining.
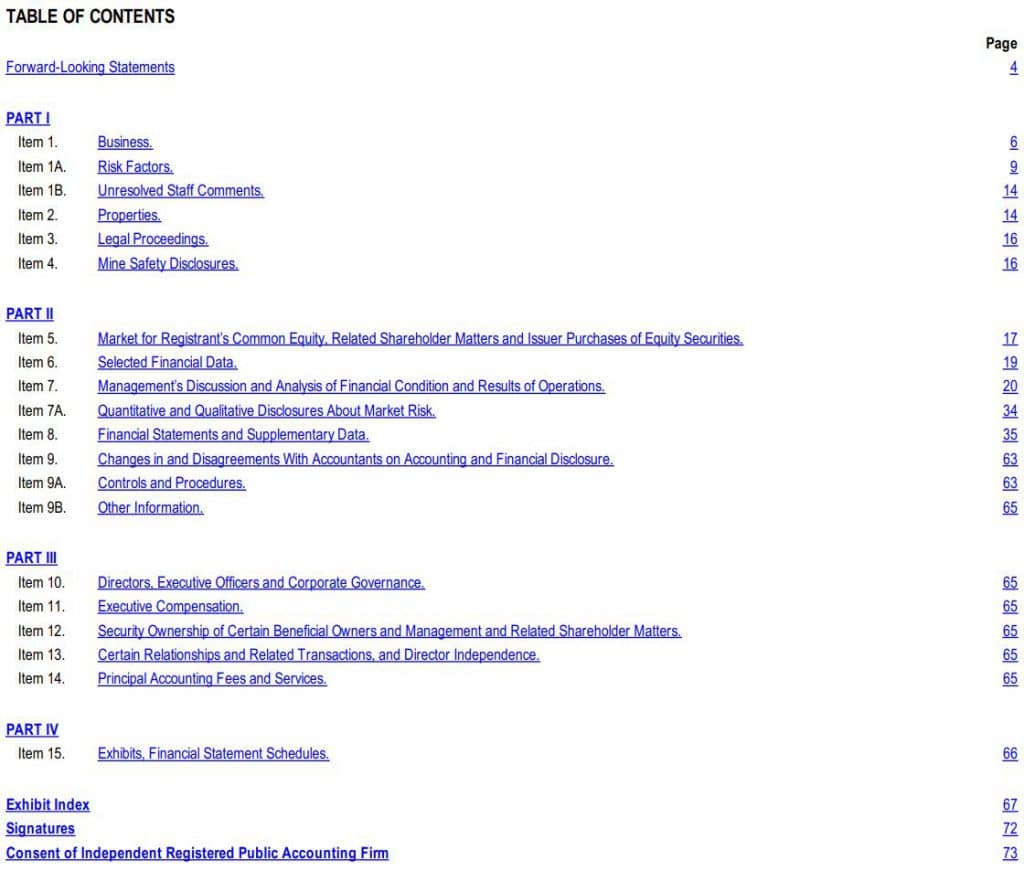
Below is an example of the table of contents from Nordstrom’s (JWN) 2018 annual report and as you can see it is a lot of information. In short, the nature of a company’s annual report is to provide an enormous amount of information the general public and their stockholders to help them understand how the company is doing. It takes a lot to read through these reports and pull the information needed, but they are created by the companies for a reason and are a great way to learn more about them! You can find the 10k of any company with public stock by looking them up on the Quotes page, then clicking “SEC Filings” on the left.


Get PersonalFinanceLab
This lesson is part of the PersonalFinanceLab curriculum library. Schools with a PersonalFinanceLab.com site license can get this lesson, plus our full library of 300 others, along with our budgeting game, stock game, and automatically-graded assessments for their classroom - complete with LMS integration and rostering support!
Learn More[qsm quiz=181]


 Imagine a borrower wants to borrow $1,000 from the bank for a 1-year loan. The bank starts with their baseline interest rate of 3% – they want to make sure that they can expect $1030.00 at the end of the year.
 Different people have different levels of risk aversion, and this will change as we change what is at stake. In our coin toss example, we can lower the stakes: heads you get $1, or you can take 50 cents without a toss. In this case, a lot more people would take the bet on the coin toss, since the risk involved is quite small.

 Intellectual property rights give people and businesses exclusive rights to profit from their ideas though the use of patents and copyrights. This means if you write or invent something, another manufacturer cannot simply copy your idea and profit from it themselves.
 If a country has weak capital rights, it means that businesses and savings can be easily “appropriated” by the government, usually through very high taxes, but occasionally through direct seizure.
 “Growth” means pushing out the total economic frontier – the most advanced technology that powers the growth in fully-developed economies.
 The most restrictive picture of the money supply is the physical cash and coins. In other words, how much currency is circulating in the economy. M0 does not count any “electronic money” (like money deposited into a checking account). M0 is not used very often anymore, since it is so easy to spend money directly from a bank account.
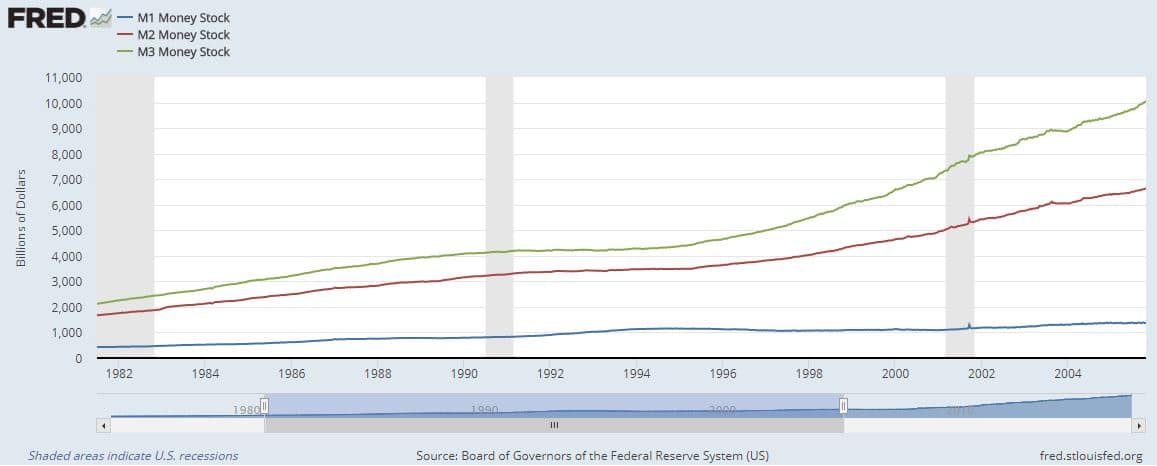
 Inflation and growth are closely related. The economy grows when more people invest their savings to help business grow, and spend more money on consumption. This means growth is usually funded by borrowing – most businesses take out loans to help fuel their own growth.
 Runaway inflation is what happens when this balance breaks. If too much money enters the money supply before it starts to get paid back, businesses start counting greater and greater “expected” inflation in their business plans. This means businesses start raising their prices more and more just to make sure they can afford their expected higher costs, forcing all other businesses to do the same.
 There are limits to how much can be done just by tweaking interest rates. For example, if there is high inflation but low economic growth, both raising and lowering the interest rates look like bad options.
 Trade deficits need to be funded by either trying to increase exports in the future, or through saving and borrowing. Since this pulls money out of the economy, the economy needs to grow at a higher pace to account for the loss. Having a trade deficit is not necessarily a bad thing. For example, developing countries may run a trade deficit while importing high-tech communications materials and construction equipment, which is used as the foundation for future growth. While they may have a trade deficit every year on paper, the growth it generates can result in a long-term net benefit.
 How close countries are geographically also plays a major role in international trade, specifically because of shipping. It costs a lot more to ship goods farther distances. In fact, big countries may import and export the same goods to and from different places. The United States exports oil to Japan from its oil fields in Alaska, while simultaneously importing oil from Canada. The Alaskan oil fields are much farther away from American oil refineries than the Canadian oil fields in Alberta, so both countries benefit by the import/export arrangement.
 One country may be intending to specialize in the production of some good or service, but they do not yet have a comparative advantage on the international market. For example, Indonesia is one of the world’s leaders in the production of fabric and textiles, but 30 years ago they were just starting their development.
 In these textile scenarios, the customers are the clear losers (faced with higher prices) and the domestic businesses are the clear winners (enjoying higher prices and subsidies to grow). However, it is not an even split. Most customers will only notice prices going up by a small percentage, while the affected businesses will see their profits soar.
 This means that countries trying to boost its own economy will try to “weaken” its own currency by using government resources to buy up many other currencies, driving up the price of other currencies and driving down the price of their own. This makes it easier for their own businesses to export, while automatically making it more expensive to import from outside. Weaker currencies generally favor businesses by raising prices, while stronger currencies benefit consumers by lowering prices.
 The Consumer Price Index is the most basic way to measure inflation. Economists pick a set “basket” of goods, and simply compare their prices between years. For example, the CPI can include milk, eggs, bread, televisions, computer monitors, compact cars, circular saws, and hundreds of other products. The “basket” will have one of each item.
 The biggest disadvantage of the GDP Deflator is that it is very hard to calculate. Instead of having a basket of a few hundred specific products like CPI, the GDP deflator needs price AND quantity data from thousands of different products every year.

 One of the biggest factors that ended the Great Depression was the outbreak of World War II. When war was declared, it caused a dramatic shift in the way the government was spending money, and simultaneously transformed the workforce. Unemployment went from near 30% of all potential works down to almost zero, partially because the army drafted millions of people into military service (removing them from competition for potential jobs), but also because there was a dramatic increase in spending to private companies to build weapons, farmers to grow food for the allied armies, and dozens of other industries for war materials.
 The impact of social protections are usually unbalanced between those who benefit (or are harmed) from the change, and those who are protected by the regulation. For example, when states began requiring Barbers to get a license in order to cut hair for money, many barbers switched professions, and the remaining ones increased prices between 10% and 15%. This was a huge impact on barbers – some lost their jobs, while others saw a big pay increase. For everyone else in the economy, there was so little change that it may not have been noticed.
 There are two main ways the government tries to control the economy – through “fiscal policy”, and “monetary policy”. You can tell them apart both by who is doing the control, and what type of impact it has.
 One of the constant political “hot topics” is whether to cut taxes to fuel growth. If we look at the “Sledgehammer and Scalpel” view of fiscal policy, this makes sense – putting more money into people’s pockets will drive growth across the economy.

 Whenever you buy something, the “dollar cost” is the actual money you spent on the purchase, but you lose more than just money when you spend it. You also lose the potential to spend that money on something else – this is what is known as the “Opportunity Cost”.
 Your own personal time value of money is what determines how much you spend and save. This is the Japan versus Kitten problem that you face every day: whatever you spend today, you cannot save up for a bigger (and potentially better) purchase in the future.
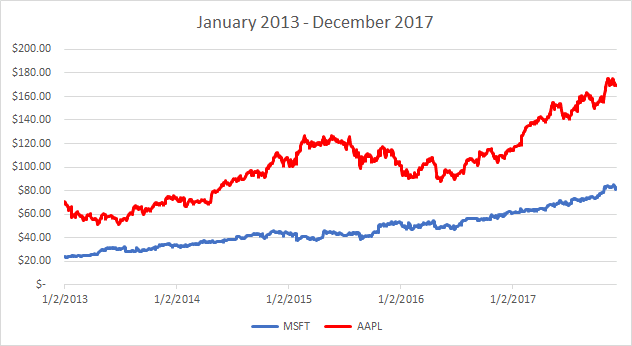
 Apple (
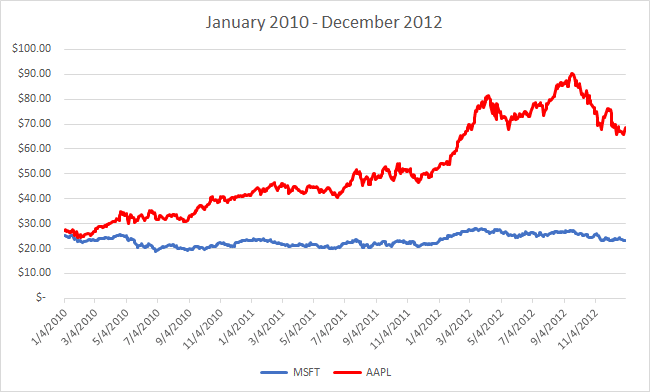


 The main difference between managerial accounting and financial accounting is not that financial only focus on financials and numbers. Both of these rely heavily on numbers and interpreting them. The biggest difference is drawn from managerial accounting focusing also on operational reports throughout the company, and also not being held to certain compliance laws that financial accountants must obey. To be able to understand the more specific differences, we should start with a definition of both.
 A fixed cost is an initial cost taken on by the company. It is a one time charge that is not contingent on the amount of something manufactured. On the other hand, a variable cost is something that is charged per unit manufactured. This process is important in this situation, because if a company can forecast how much they will need something, then they can choose one or the other. If the amount that they are outsourcing is lower when the calculation is completed than the initial fixed cost of setting up the facilities, then it would be better to outsource. However, should they be better off to produce in house should they be making a larger amount of products. This will make much more sense once the numbers are introduced.
 Cost allocation is the process of assigning cost to different cost objects. A cost object can be anything from square footage to a headcount in an office. Essentially, you can value something and add your cost to something in order to find a fair way of spreading it out.
 Market segmentation is the process of dividing a market of potential customers into groups (segments) based on different characteristics. Because of the different strategies that are used for different consumer groups, it is easier for marketers to personalize campaigns, and engage new customers. This is how target marketing matches marketing efforts to the needs of a specific market segment. By putting the target market into segmented groups, marketers can be more efficient with their time and potentially save money on campaigns. This is a more cost effective way for the company to market their business.
 Demographic Segmentation is the most important criterion for measuring a target market. Marketers usually have good ideas about how big different demographic segments are based on measurable statistics, which can easily be retrieved from the census bureau online. Once they know the size of each demographic, they can use polling data to find the specific tastes and preferences of each group. Groups are usually defined by:
 Psychographic Segmentation divides the target based on socio-economic class, personality, and lifestyle preferences. There is a scale that is used and it ranges from the highly educated being at the top, all the way down to the uneducated and unskilled at the bottom. Marketers use this type of segmentation to figure out consumers based on their education, economic status, social status and working class. some categories include:
 These tools above are used in market segmentation and there are different ways that all three of these tools are put together in order to find the perfect market to advertise their product. For instance, a business that sells high tech baby supplies will need to identify a target market. The business will look at the demographics and take a poll on anyone within the millennial age that are more likely to have children and what they prefer as their supplies. Next, they will look at the geographic and psychographic segment and narrow the market to those who have upper management jobs who can afford the high tech baby supplies and who live in maybe an urban region where technology is used in people’s lives every day. Narrowing the target market saves time and money by focusing only on the potential customers who would be most interested – sending advertisements for high-tech baby supplies to retired males is likely just wasting money.
 Brokers help individuals trade securities, the security type will change depending on the broker, but they usually fall into these categories:
 “Brokers” are people who bring two interested people together to make a trade, they are the “middle man” of the transaction. “Dealers,” on the other hand, are usually directly involved in the transaction. Dealers would be like a storefront, they buy goods from their own suppliers, then sell them to the final consumer.
 The buy or sell process within a brokerage account is called Trade Execution. Trade execution is an investor confirming the desire to buy or sell an investment or security. Once the investor signals their intention to place a trade, it starts the Trade Capture process.
 All securities and investments have a cost. The cost may come in the following forms:

 A company’s culture involves different aspects of their organizational beliefs, image, and structure. This includes the company’s mission statement, how they handle public relations, and how they handle their employees. If a company has a good public and private standing, then their culture would be considered a strength. However, if they have a bad public image, such as Comcast, or internal employee discontent, like Google, you could deem their culture to be a weakness that needs be improved.
 Matrixed management is a bit more difficult. This management structure attempts to combine the strengths of both horizontal and vertical management. Many larger companies are trying to move into a matrixed structure, but the details are still being tweaked. This type of structure is not as old and well researched as the others, so companies are still trying to see what the benefits and disadvantages are. It is also much harder to integrate, because it requires a thorough understanding from both executives and those who report to them.
 Threats in your SWOT analysis will consist of problems that could arise for your company due to either internal or external threats. Employee discontent, expiration of a patent, or legal issues would all be considered internal threats that could potentially harm future business operations. External threats, which can consist of competitor innovation, government regulation, or an economic recession could also pose a serious threat to business operations. When analyzing for threats to a company, the primary concern is whether something will negatively impact business operations. If something positively impacts business operations, it would be considered an opportunity.
 According to documents filed in the US District Court of Massachusetts by the Securities and Exchange Commission, Fields and Latorella created a number of fictitious companies including one called Omni Data Services (ODS) which the two executives falsely charged for services from LocatePlus which it did not actually provide but which Omni Data paid for using funds routed from LocatePlus to ODS through the other fake entities which the executives created in order to hide their illegal activities.
 Naturally, laws exist to protect stockholders from this sort of fraud. Both Fields and Latorella plead guilty to violations of the Securities Act of 1933 and the Securities Exchange Act of 1934, receiving both prison time and orders to pay restitution in an amount exceeding $4.9 million. The third conspirator, O’Riordian plead guilty to separate securities fraud charges.
 Because criminals fail to consider or don’t care how their actions affect other people, citizens, even though governments have created laws in the hopes of limiting fraud and law enforcement agencies to punish those who do.
 Once the information in any case becomes clear, the next step is to identify any violations of laws or regulations.
 The truth of the matter is that a successful marketing strategy is deeply rooted in a firm’s ability to build positive relationships with consumers by consistently providing a high-quality product, exemplary service, and an outstanding customer experience. This ability is often referred to in the business world as the firms’ value proposition. In other words, what unique offerings does the company propose to the consumer to entice them to want to buy their products or services over the competition’s?
 The function of marketing at its core is to make a business’ product or service more relevant and desirable, as well as ultimately transform that product or service from a desire to a necessity for the targeted market. The end customer can vary widely in identity, goals, and desires.
 For most people, the corporate bond market is often not as well known as the stock market, but it plays an equally important role in the finance world. Say a company like McDonald’s needs $1 million to open 10 new restaurants, but does not have enough cash to pay for it. Or, perhaps they do have enough cash available, but they prefer to save it or invest it in other areas of the business, rather than burning through all of it for this new restaurant expansion. In this scenario, the likely solution would be to issue debt. With the help of a major bank, like Goldman Sachs or Morgan Stanley, McDonald’s would issue (sell) $1 million worth of debt (bonds). The bonds are put into the financial market for investors around the world to buy. Each time a company sells bonds, there is a fixed maturity and interest rate pinned to the bonds. The maturity, which can range anywhere from a few months to 30 plus years, is the date when McDonald’s has to pay the investors back the full amount they borrowed.
 Regular, guaranteed, and (usually) higher dividend payments, plus you get paid back first if the company goes bankrupt – who wouldn’t buy preferred stock over common stock? Preferred stock is not as prevalent as common stock, making it much harder to actually get these shares. If you look at the thirty largest U.S. companies based on their total stock value, only four have preferred stock outstanding. They are Wells Fargo (
 Selling additional shares of stock can come at a cost to the current stockholders because it reduces their proportional ownership in the business. This is called dilution. Putting it into context, consider the example of the startup technology company selling additional stock. If there were 10 original investors who collectively purchased 10% of business – for simplicity, assume they each got 1 share. Next, let’s assume that the additional 10% sold from the new issuance were bought by 10 different investors who also each receive 1 share. Originally, each investor owned 1 share out of the 10 shares total. Now, after the additional issuance, that same investor owns 1 share out of 20 total. This dilutes the shareholders proportional ownership in the company. This can cause the Earnings Per Share (EPS) and value of the stock to decrease.
 Advertisements are a great way to spread knowledge about a product or service, but sometimes the messages in advertisements are questionable. Vintage advertisements from the 1950s and 1960s, for example, were created in an era with far less oversight. Today, many of these ads are seen as more offensive and unethical than persuasive. If you look at an ad for Camels cigarettes from the 1950s, you’ll see a doctor smiling while holding a cigarette, with the caption, “More doctors smoke Camels than any other cigarette”. This ad is hypocritical since doctors spend their careers advocating for healthy lifestyles. It also sends a message to society that if doctors are smoking then it must not be bad.
 Culture has a big influence on ethical principles since it refers to a set of values and attitudes that are shared among a group of people. However, not all cultures are the same which makes ethics vary among countries. Ethical standards should be relevant to international markets and should be equal in all markets, meaning that ethical practices carried out in the home country should be carried out internationally as well. Avon (
 Moral idealism is a moral philosophy that no matter what the outcome, individual rights must always be protected. This philosophy can be found in the ethical practice of informing consumers of safety hazards in a product or service, or recalling a defective product no matter the cost, so long as consumers are protected.
 Some characteristics of the working class that could affect their buying decisions include limited post-secondary education, some occupy unskilled work positions, and may travel long distances to get to their work places. For example, a restaurant dishwasher (who is part of the working class) would typically purchase his groceries in places where those in the upper class would not necessarily shop in.
 While businesses such as manufacturing plants purchase goods and services to turn them into consumer goods that are then consumed by the end-user, there are also groups in the marketplace whose goal is not to make profits. These include government institutions and non-profit organizations. For example, the government branch responsible for building and maintaining interstate roads buy asphalt and gravel from businesses to use for highways. These highways are not built for profits per se, but mainly to facilitate travel.
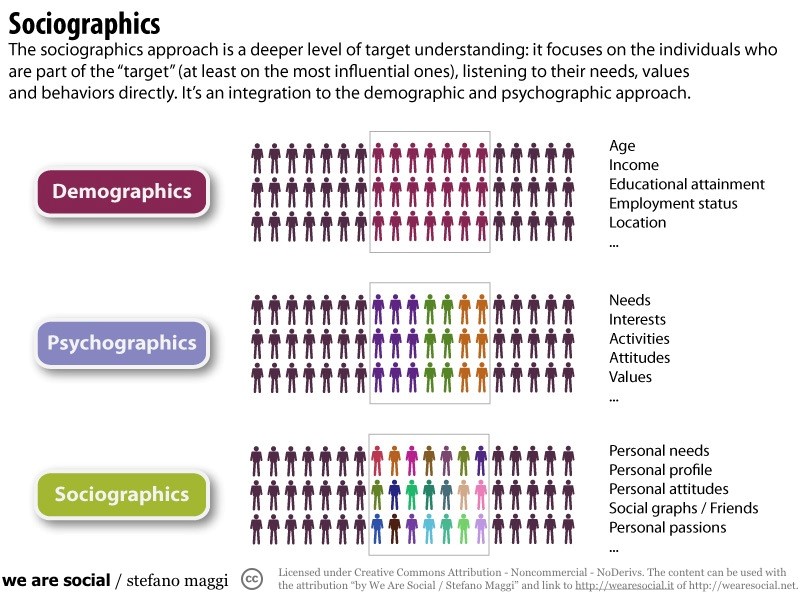
 “Psychographics” is the study of consumer lifestyles. While demographic studies see individuals as parts of specific groups, psychographics aims to create a more wholesome profile of the consumer as part of a small group within the target market. For example, a psychographic analysis of an individual born after 1998 would show her preference of watching documentaries on Netflix rather than watch a documentary on cable channel. The same analysis done on a male university student would show his preference to hailing from a ride-sharing app rather than taking a cab.
 Dividend Amount
 As a shareholder, in addition to receiving dividends, you can vote on certain corporate restructuring plans that the board of directors proposes to the shareholders. Corporate Restructuring means making the business leaner through possibly merging departments, eliminating debt, or possibly merging or being acquired by another company. A recent example now is Valeant Pharmaceuticals (
 During the acquisition, the two main payments are similar to dividends: they can come in the form of cash (direct cash payment to each shareholder for their shares) or stock (shareholders of the acquired company are given shares of the new company). Generally speaking, the company acquiring the target overbids the current stock price. PPG’s bids for Akzo Nobel will be used below as an example.


 Clothing


 At one point, a company’s plans become so big that it needs public financing to support future development, and so they sell stock to raise the cash needed to grow. This point is when a private entity becomes public. A public corporation is financed by the ‘public’ which means millions of investors, and which means huge capital. The most significant step in creating the corporation is its registration as a legal entity. A state issues articles of incorporation to the firm that legally recognizes the status of the corporation as an independent entity. The certificate of incorporation identifies the name, address, and the field of operation of a new corporation and describes the stocks to be issued.
 Issuance by subscription is the case of selling shares on ‘loan’, where investors do not have to pay the full amount at once. However, paying a part of the amount gives the investor a subscription status, which means he/she will be assigned with the particular amount of shares. This investor cannot enjoy the rights, and the shares are not officially counted and recorded as issued until the full amount is paid.
 Preferred: 13,000,000/24,500,000 * 23,000,000=12,204,081.6
 Preferred stock gives its shareholders the ‘preferred’ status among other shareholders. Therefore, the price per preferred share is usually higher than for a common share. However, the dividends that are paid to preferred shareholders are fixed and do not evolve with the company growth and development. This limits preferred shareholders from gaining from the company’s price growth. For this reason, it is very common for preferred shares to be convertible.
 Dividends are the payment the investors gain in return for their investment. Dividends can be paid monthly, quarterly, or semi-annually depending on the company’s dividend payout policy. Companies are not liable to pay out the dividends until they declare it. This means in bad years, many companies simply do not declare dividends, instead building up cash reserves. If they can, companies usually have an incentive to pay dividends, since it is a good sign of the company’s financial position that helps to raise the share price overall. This means , for most companies, dividends are paid on a regular basis. When the company declares the dividends, they become a liability for the company, and are located under dividends payable account.


 Business is surrounded by risks – if they are not properly managed, the business will shut down.
 Having already experienced the loss, the business must defend against the spread and growth of the loss. This seen in a global business where factories, warehouses, and other infrastructures are located in many different places in different parts of the world. If a factory in Lima, Peru explodes and all the inventory and supplies are destroyed, there is still a factory in nearby Rio De Janeiro, Brazil to fulfill customer orders. Another example, by compensating workers for work-related injuries with wages that could have been earned, plus extra to cover expenses of the injury, adequate time to recover, and anything else the employee may require, which also involves changing work conditions, the company will reduce further losses from fines and penalties carried out by government, health, and safety agencies by doing right by those who are harmed and getting things right with the law. This is a case where spending extra money up front reduces the probability of a bigger loss down the line.
 When a business commits a crime, the consequence can range from hefty fines to imprisonment (if specific individuals are definitively linked to the crime). For example, this happens when many people get sick or die when using a company’s product or service and management knowingly signed-off on the inclusion of life-threatening materials. More commonly this is accounting fraud, where the management of a business knowingly manipulates their financial statements.


 Cash budgeting allows an organization to set a goal and move toward that goal. This is important because each organization has a finite amount of resources and these resources need to be used effectively. Management uses cash budgeting to manage the cash flows of an organization. For example, employees must be paid every two weeks. The cash budget allows management to forecast whether or not they will have enough cash to pay their employees. If there are shortfalls of cash, the budget may be adjusted to correct problems before payments are due.
 Leading is about taking the lead: initiating, inspiring, and motivating workers. It is about fostering passion to continue to work and exceed expectations, improve standards for product quality and manufacturing, set industry standards for quality and production, and generally being a great example for others to follow. When managers lead workers, they are helping them realize that managers objectives and goals coincide with their personal ambitions, in addition to the company’s overall mission, vision, and goals.
 This is also known as Democratic leadership, because everyone gets heard and everyone is included in the decision-making process. This type of leader knows that they cannot move mountains by themselves, so they collaborate with those around them and establish long-lasting, meaningful relationships. They understand the importance of networking in achieving objectives and goals. People working under this leadership style tend to feel more satisfied with their work and feel more valued for their contributions. Situations where creativity and innovation are integral work best with this leadership style, such as in software and hardware development companies, product engineering, and so on.
 Transformational leaders are also known as change leadership because this leadership style tries to effect changes (making a difference) as the purpose of management. This type of leader sees everything and everyone as something that can be improved and revolutionized. Transformational leaders represent the best in human and business standards in that they seek to improve employee morale by seeing value in them, make the workplace better by spreading positivity, exemplify high moral standards, emphasize ethical considerations, use logic and reasoning to win people over, and providing workers with options and opportunities.
 The manager will take the lead in this phase by doing research on what company problems need to be fixed or addressed in some way, and directing those qualified to obtain needed information. Next, they will gather everyone involved to introduce a structure to the plan to make it more achievable to gain perspective on what direction the manager and company should go with this. After considering everyone’s input and suggestions, the manager has a better idea of what needs to be done to solve the problem and contain any issues that may arise.


 In an income statement, Operating Cash Flow (OCF) is similar to Earnings Before Interest and Taxes (EBIT). Both show how much cash a business can generate from normal operations. It excludes other major items in an income statement that impact net income (interest and taxes). These items are excluded because they are not operational expenses.


 The process begins with a company discussing the pitch for an IPO with bankers. The company selects book runners and co-managers who will be responsible in selling the newly issued stocks for the primary bank. The company must file the registration forms and discuss the timing of the IPO. The bankers then conduct due diligence, a process by which they speak to customers, do research and analysis on the industry and trends, figure out the legal situation, and sift through the financial statements and make sure there are no irregularities. The S-1 form is filed after the due diligence, which releases the historical financial statements, key data, and other information investors would like to see before making a purchase decision.
 Finally, stock price fluctuations deal with the concept of risk. There are two types of risk, systematic and unsystematic. Systematic risk is an event that can affect the stock market as a whole. Unsystematic risk is specific to the company or industry. Beta is the measure of the volatility a stock has in comparison to the market as a whole. A beta greater than 1 represents a stock that will move higher than the market in periods of growth but decrease more in periods of decline.